


El Kahera El Watania Investment
KWINEl Kahera El Watania Investment
Company Overview & Activities
ترويج وتغطية الإكتتاب فى الأوراق المالية والإشتراك فى تأسيس الشركات التى تصدر أوراقا مالية وفى زيادة رؤوس أموالها وفى تكوين وإدارة محافظ الأوراق المالية وفى تقديم رأس المال المخاطر وإدارة صناديق الإستثمار .
EGS69011C012
1997-09-08
FRA Certified Auditor
Financial FAQ & Technical Outlook for El Kahera El Watania Investment (KWIN)
Quantitative Technical Engine (KWIN)
El Kahera El Watania Investment holds a Bullish technical posture (Overall Score: 64.0/100) with Trend Score 40/100, Momentum Score 90/100 (RSI 51.87 - Bullish Momentum), and Volume Score 70/100 (accumulating, 0.57x 20D baseline).
Support & Resistance Confluence Matrix
AlgorithmicNearest support is at 71.06 [Strength: 80.0/100, Tier 1 (Macro 500D)] (0.25% below price with a 80.0% confirmed bounce rate across 55 tests, Reliability: High). Nearest resistance is at 71.6 [Strength: 56.4/100, Tier 3 (Intraday 1-min)] (0.51% above price with a 65.7% confirmed rejection rate across 35 tests, Reliability: High).
Seasonal Trend & Historical Patterns (KWIN)
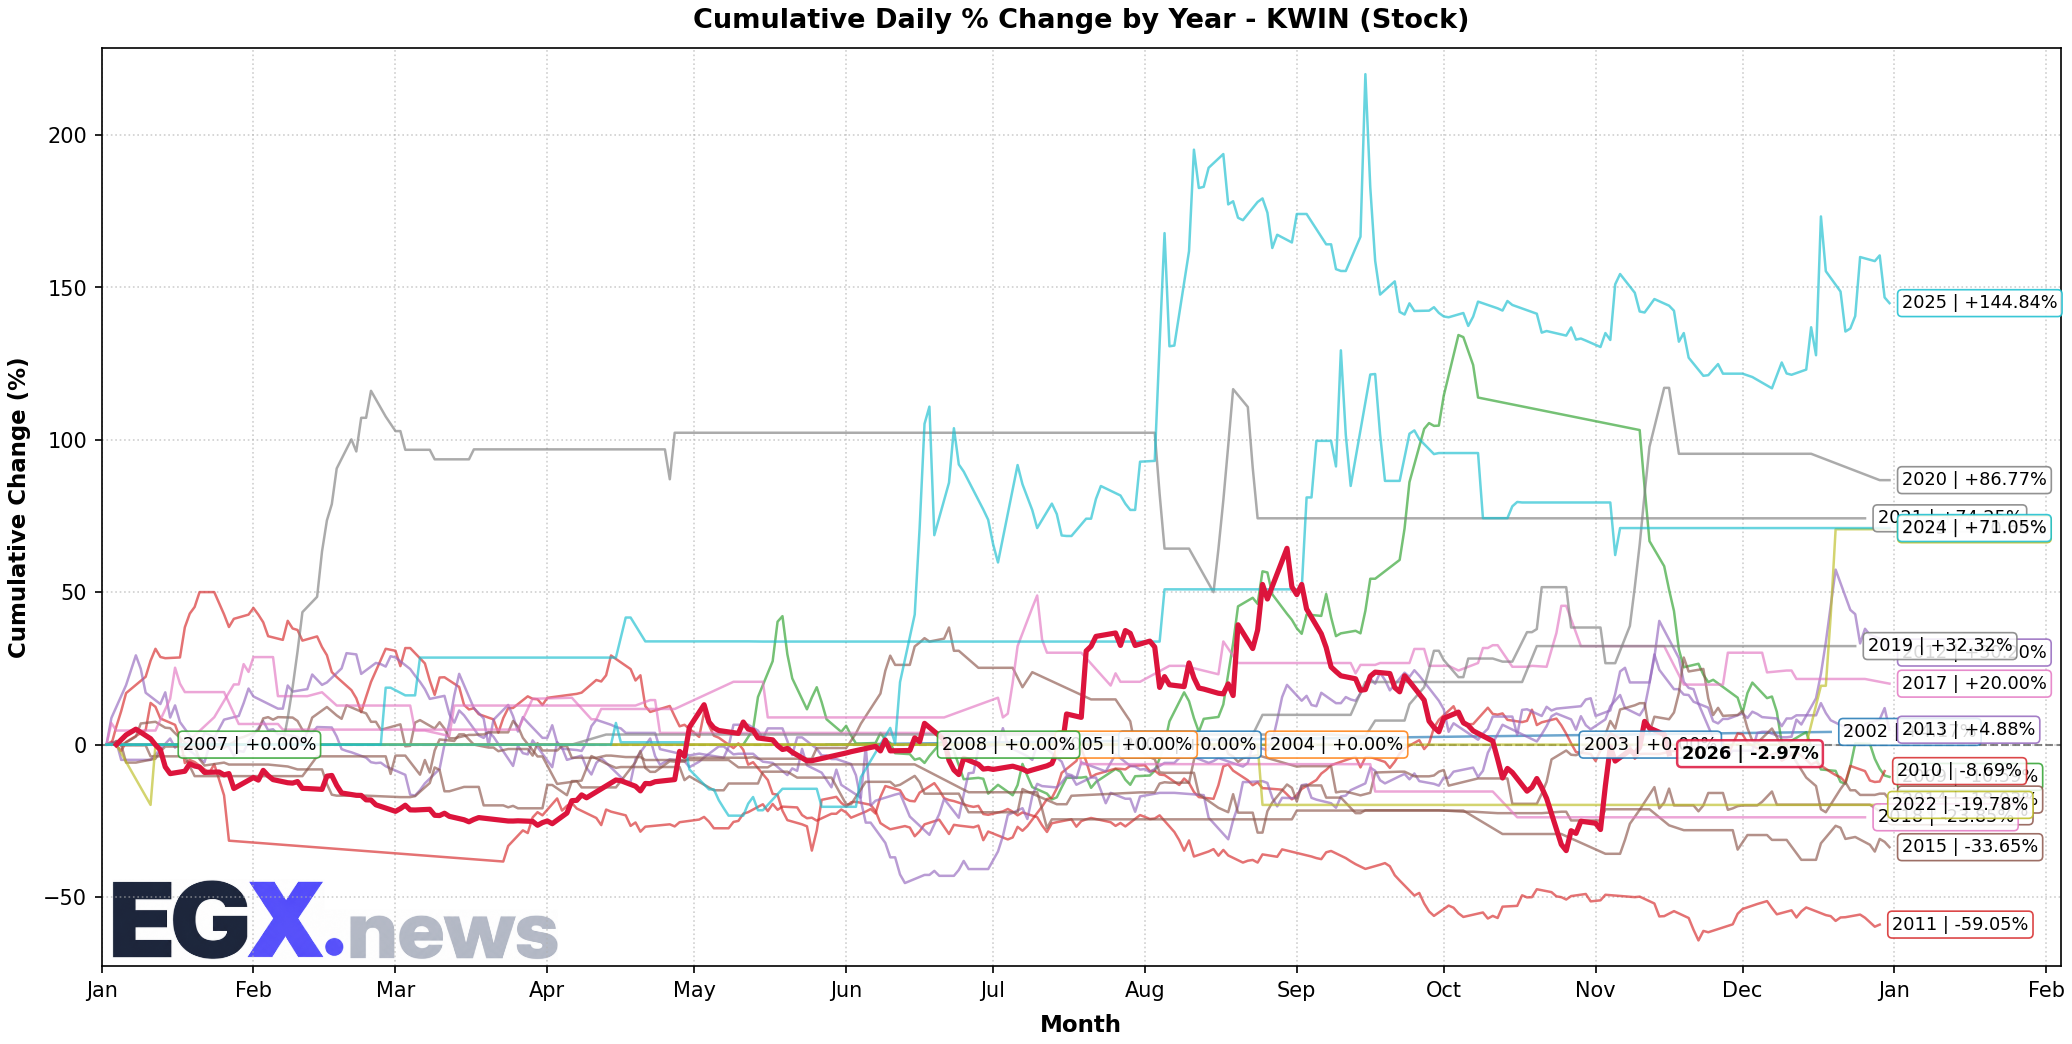
Click to EnlargeHistorical monthly seasonal return distribution and performance cycles for KWIN.
Trend Structure & Moving Averages
Golden Cross (96D)Trend Score is 40/100 with price trading 11.43% above its 20-day SMA and below the 200-day long-term benchmark (SMA50 is above SMA200 for 96 sessions).
Momentum, Volume Flow & Volatility
RSI(14) is 51.87 (Bullish Momentum), moving -2.70 over the past 5 sessions — indicating positive momentum in buyer territory. MACD line (1.001) is above signal line (-1.42) with a histogram of +2.422 (Bullish Momentum).
20-day annualized volatility is 130.49%, ATR(14) is 6.88 (9.66% of price), and price is trading in the middle channel (%B: 0.68, Bandwidth: 63.46%).
Statistical Backtests & Historical Win Rates
BacktestedEmpirical backtesting reveals that RSI oversold dips (<30) historically yield an average 20-day return of +7.82% with a 37.86% win rate (103 observations, Reliability: High), while volume spikes yield an average 20-day return of +2.32% (38.58% win rate).
Price sits 48.34% below All-Time High (137.9 set 54 sessions ago on 2026-08-31) and 48.34% below its 52-week high (137.9 on 2026-08-31).