


Elwadi
ELWAElwadi for International Investment & Development
Company Overview & Activities
إقامة وإدارة وتشغيل مستشفى متكامل وما تضمه من أنشطة داخلية علاجية أو خدمية , وأن يقدم المستشفى 10% بالمجان سنوياً من عدد الأسرة التى يتم شغلها بالنسبة إلى المستشفى ومن الحالات التى يتم تقديم الخدمة الطبية أو العلاجية لها، الإستثمار العقارى والتنمية العمرانية من شراء وبيع وتقسيم الأراضى وإقامة المنشآت عليها وإستغلالها بتمليك وتأجير وحداتها ومدها بالمرافق،على أن يتم إفراد حسابات مستقلة لكل نشاط على حدة ، ويجوز للشركة أن تكون لها مصلحة أو تشترك بأى وجه من الوجوه مع الشركات وغيرها التى تزاول أعمالاً شبيهة بأعمالها أو التى قد تعاونها على تحقيق غرضها فى مصر أو فى الخارج, كما يجوز لها أن تندمج فى الهيئات السالفة أو تشتريها أو تلحقها بها وذلك طبقاً لأحكام القانون ولائحته التنفيذية
EGS70R91C016
2012-09-06
FRA Certified Auditor
Financial FAQ & Technical Outlook for Elwadi for International Investment & Development (ELWA)
Quantitative Technical Engine (ELWA)
Elwadi holds a Bearish technical posture (Overall Score: 20.5/100) with Trend Score 0/100, Momentum Score 15/100 (RSI 24.06 - Oversold), and Volume Score 35/100 (distributing, 0.69x 20D baseline).
Support & Resistance Confluence Matrix
AlgorithmicNearest support is at 1.24 [Strength: 80.4/100, Tier 1 (Macro 500D)] (0.8% below price with a 81.6% confirmed bounce rate across 38 tests, Reliability: High). Nearest resistance is at 1.27 [Strength: 83.3/100, Tier 1 (Macro 500D)] (1.6% above price with a 93.3% confirmed rejection rate across 15 tests, Reliability: High).
Seasonal Trend & Historical Patterns (ELWA)
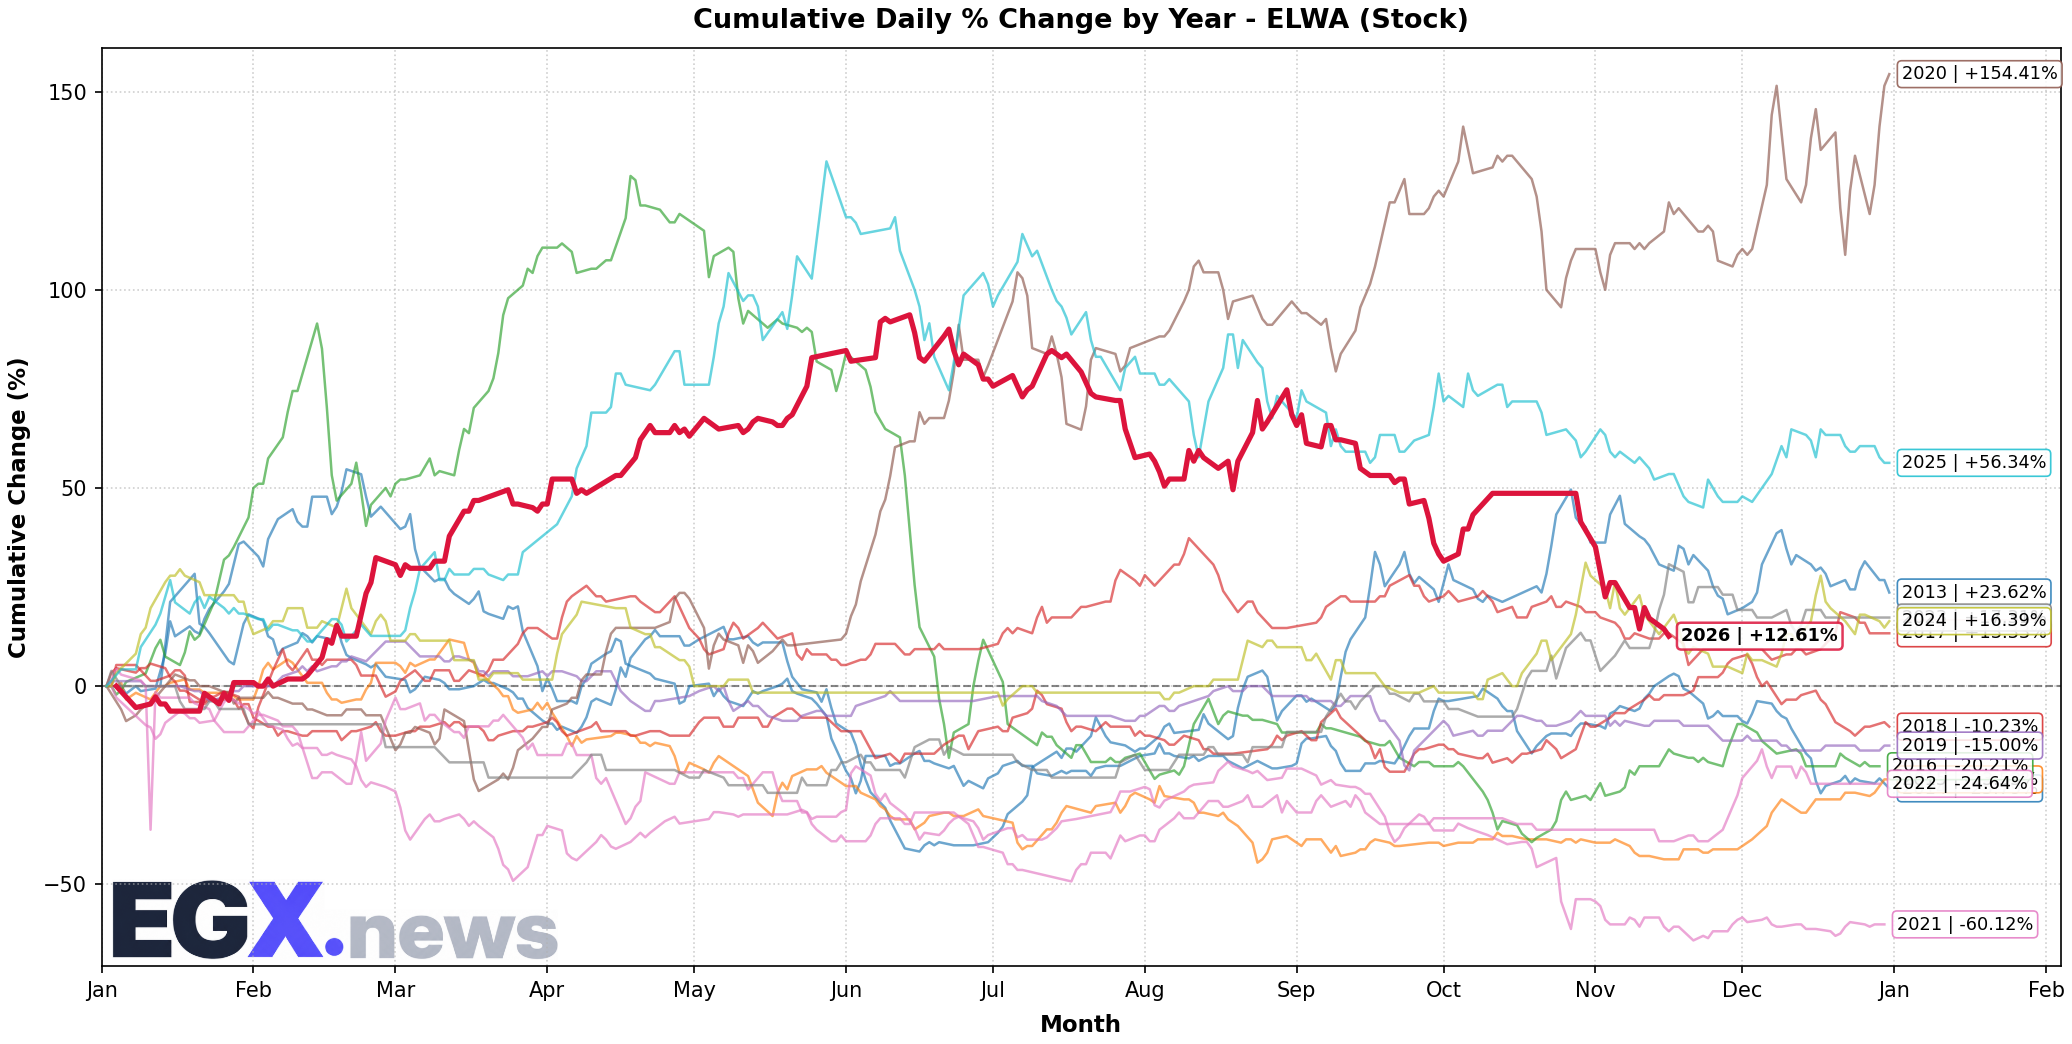
Click to EnlargeHistorical monthly seasonal return distribution and performance cycles for ELWA.
Trend Structure & Moving Averages
Trend Score is 0/100 with price trading 14.38% below its 20-day SMA and below the 200-day long-term benchmark (SMA50 is below SMA200).
Momentum, Volume Flow & Volatility
RSI(14) is 24.06 (Oversold), moving +2.98 over the past 5 sessions — signaling severe oversold conditions poised for a potential technical rebound. MACD line (-0.098) is below signal line (-0.08) with a histogram of -0.018 (Bearish Momentum).
20-day annualized volatility is 43.44%, ATR(14) is 0.07 (5.6% of price), and price is trading near the lower band (%B: 0.159, Bandwidth: 43.15%).
Statistical Backtests & Historical Win Rates
BacktestedEmpirical backtesting reveals that RSI oversold dips (<30) historically yield an average 20-day return of +1.83% with a 51.76% win rate (85 observations, Reliability: Good), while volume spikes yield an average 20-day return of +3.07% (48.15% win rate).
Price sits 50.98% below All-Time High (2.55 set 3075 sessions ago on 2014-02-23) and 43.69% below its 52-week high (2.22 on 2026-06-15).