


First Investment & Real Estate Development
FIREFirst Investment & Real Estate Development
Company Overview & Activities
الاستثمار العقارى والتشييد والتخطيط والبناء للمدن والقرى السياحية واقامة كافة الانشطة المرتبطة بها والمكملة لها من انشطة خدمية وترفيهية ورياضية وتجارية وثقافية والقيام بكافة اعمال المقاولات العامة والاعمال المتعلقة بها وشراء الاراضى وتقسيمها وتجهيزها ومدها بالمرافق الاساسية والانشطة المكملة لها والمرتبطة بها وبيعها وكذلك تجارة مواد ومستلزمات وخامات البناء بمختلف انواعها وتنفيذ بنود عملية البناء فى كل من اعمال الحفر والتاسيس الى اعمال التشطيبات المتكاملة والديكورات وبناء المشروعات السكنية او الوحدات الادارية والتجارية بقصد التمليك والايجار , والتوريدات العمومية والاستيراد ولتصدير والتوكيلات التجارية 0000 الخ
EGS65AL1C010
Listed on EGX
FRA Certified Auditor
Financial FAQ & Technical Outlook for First Investment & Real Estate Development (FIRE)
Quantitative Technical Engine (FIRE)
First Investment & Real Estate Development holds a Bullish technical posture (Overall Score: 71.2/100) with Trend Score 65/100, Momentum Score 100/100 (RSI 58.78 - Bullish Momentum), and Volume Score 70/100 (accumulating, 0.83x 20D baseline).
Support & Resistance Confluence Matrix
AlgorithmicNearest support is at 4.65 [Strength: 65.0/100, Tier 3 (Intraday 1-min)] (1.69% below price with a 100.0% confirmed bounce rate across 5 tests, Reliability: Moderate). Nearest resistance is at 4.74 [Strength: 45.0/100, Tier 3 (Intraday 1-min)] (0.21% above price with a 100.0% confirmed rejection rate across 1 tests, Reliability: Low).
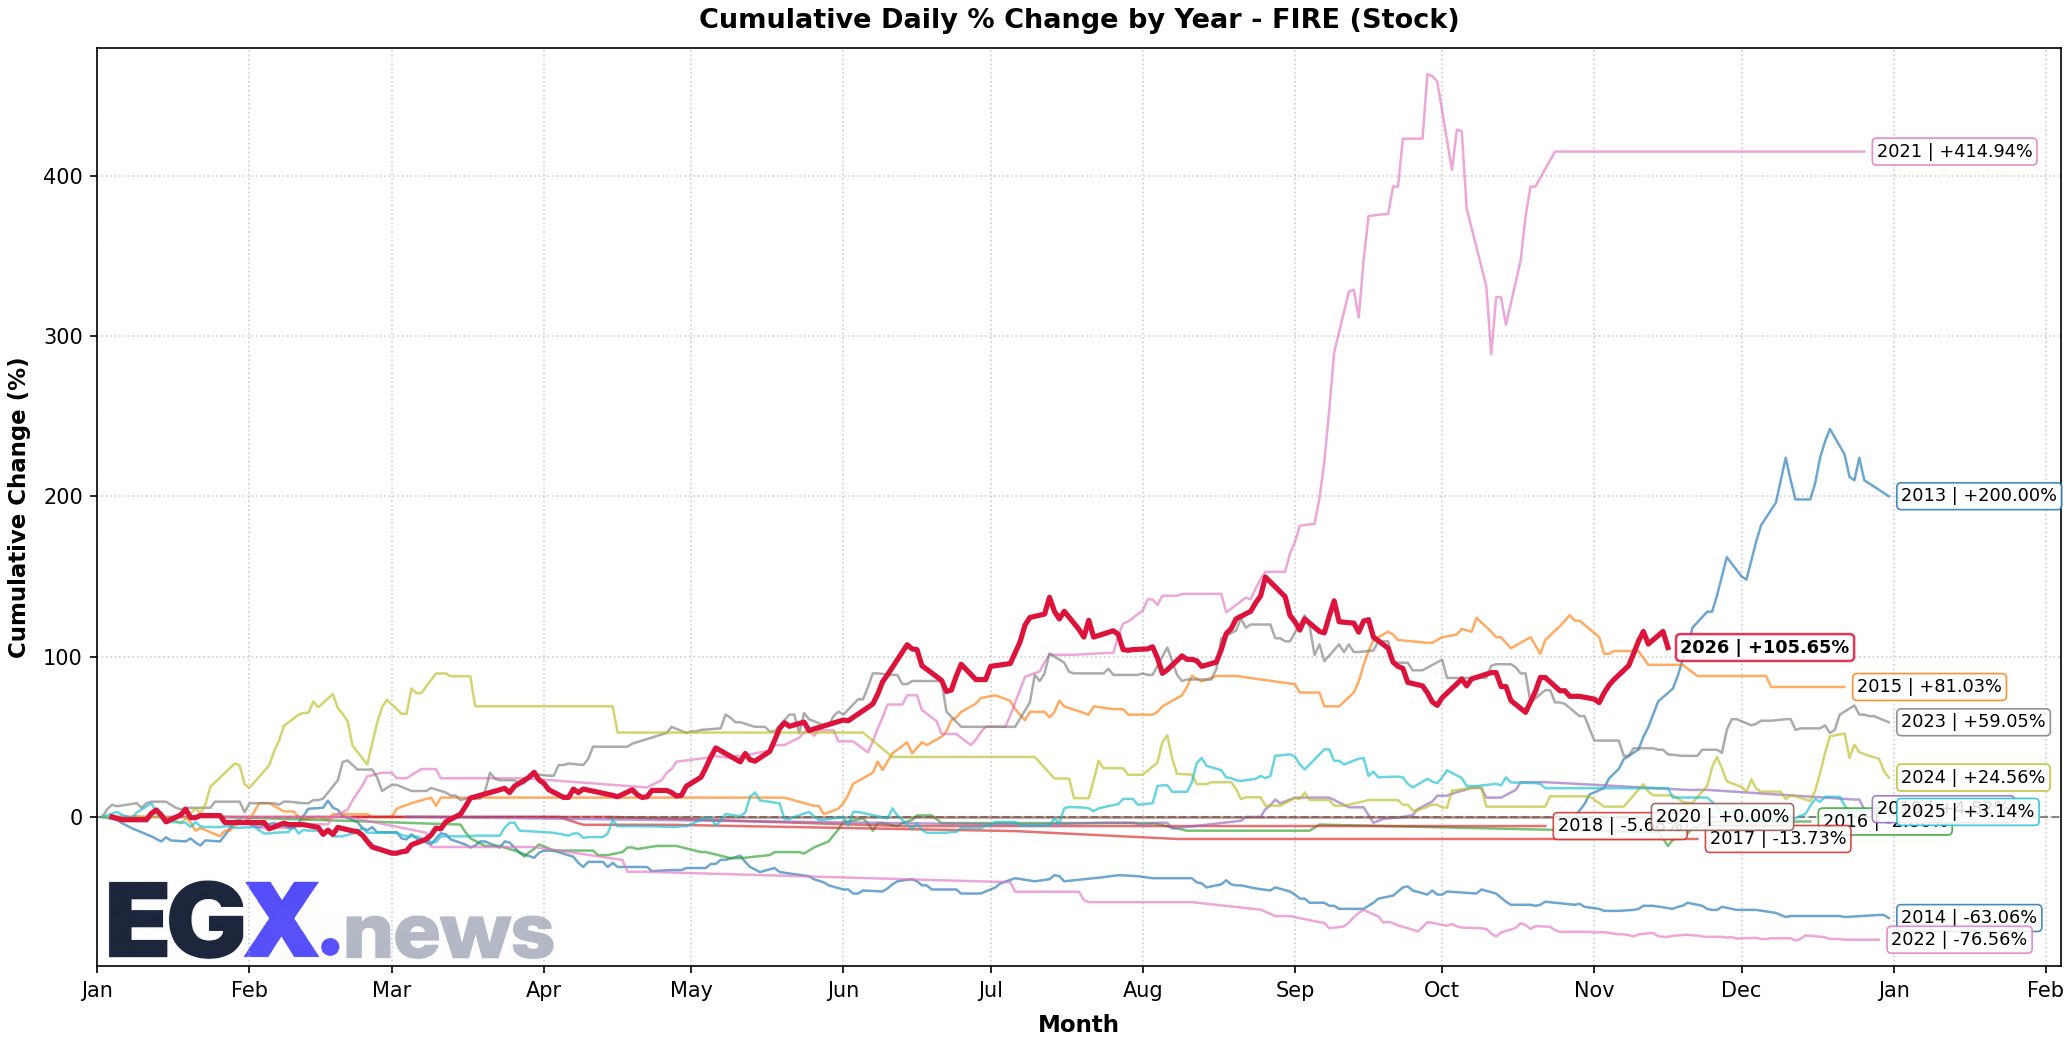
Seasonal Trend & Historical Patterns (FIRE)
Click to EnlargeHistorical monthly seasonal return distribution and performance cycles for FIRE.
Trend Structure & Moving Averages
Golden Cross (122D)Trend Score is 65/100 with price trading 8.99% above its 20-day SMA and above the 200-day long-term benchmark (SMA50 is above SMA200 for 122 sessions).
Momentum, Volume Flow & Volatility
RSI(14) is 58.78 (Bullish Momentum), moving -5.45 over the past 5 sessions — indicating positive momentum in buyer territory. MACD line (0.148) is above signal line (0.055) with a histogram of +0.093 (Bullish Momentum).
20-day annualized volatility is 48.63%, ATR(14) is 0.27 (5.71% of price), and price is trading in the middle channel (%B: 0.777, Bandwidth: 32.03%).
Statistical Backtests & Historical Win Rates
BacktestedEmpirical backtesting reveals that RSI oversold dips (<30) historically yield an average 20-day return of -1.30% with a 41.46% win rate (41 observations, Reliability: Moderate), while volume spikes yield an average 20-day return of +4.96% (53.85% win rate).
Price sits 21.3% below All-Time High (6.01 set 55 sessions ago on 2026-08-30) and 21.3% below its 52-week high (6.01 on 2026-08-30).