


Gharbia Islamic Housing Development
GIHDGharbia Islamic Housing Development
Company Overview & Activities
1.العمل فى كافة مجالات الإستثمار العقاري وشراء الأراضي و المشاركة عليها وتقسيمها ومدها بالمرافق بغرض تشييد مبانى عليها على اختلاف أنواعها و نشاطها لغرض بيعها أو تأجيرها. 2.كافة اعمال التطوير العقارى و ادارة المشروعات و التصميم و الاشراف على تنفيذ و التشطيبات و التسويق و البيع و التحصيل لكافة المشروعات العقارية . 3.القيام بجميع أعمال المقاولات المتكاملة والتخصصية وإقامة مشروعات ذات النشاط الصناعي والسياحي و السكنى والخدمى و الاسواق التجارية و المباني الادارية والتعليمية و المستشفيات ومباني الخدمات الصحية والترفيهية والرياضية لتأجيرها أو بيعها. 4.تطوير الاحياء القديمة و شراء المبانى القديمة و هدمها و بيع اراضيها او اقامة مشروعات عقارية عليها و التصرف فيها بالبيع و الايجار . 5.تصنيع مستلزمات الإنتاج اللازمة لخدمة أغراض الشركة . 6.كافة انشطة البناء و ما يرتبط بها . ويجوز للشركة أن تكون لها مصلحة أو تشترك بأي وجه من الوجوه مع الشركات و غيرها التي تزاول أعمالا شبيهة بأعمالها أو التي قد تعاونها علي تحقيق غرضها بمصر أو في الخارج .
EGS65461C013
1994-09-12
FRA Certified Auditor
Financial FAQ & Technical Outlook for Gharbia Islamic Housing Development (GIHD)
Quantitative Technical Engine (GIHD)
Gharbia Islamic Housing Development holds a Bullish technical posture (Overall Score: 67.5/100) with Trend Score 50/100, Momentum Score 90/100 (RSI 51.86 - Bullish Momentum), and Volume Score 70/100 (accumulating, 0.69x 20D baseline).
Support & Resistance Confluence Matrix
AlgorithmicNearest support is at 51.59 [Strength: 45.0/100, Tier 3 (Intraday 1-min)] (0.77% below price with a 100.0% confirmed bounce rate across 1 tests, Reliability: Low). Nearest resistance is at 53.0 [Strength: 45.0/100, Tier 3 (Intraday 1-min)] (1.94% above price with a 100.0% confirmed rejection rate across 1 tests, Reliability: Low).
Seasonal Trend & Historical Patterns (GIHD)
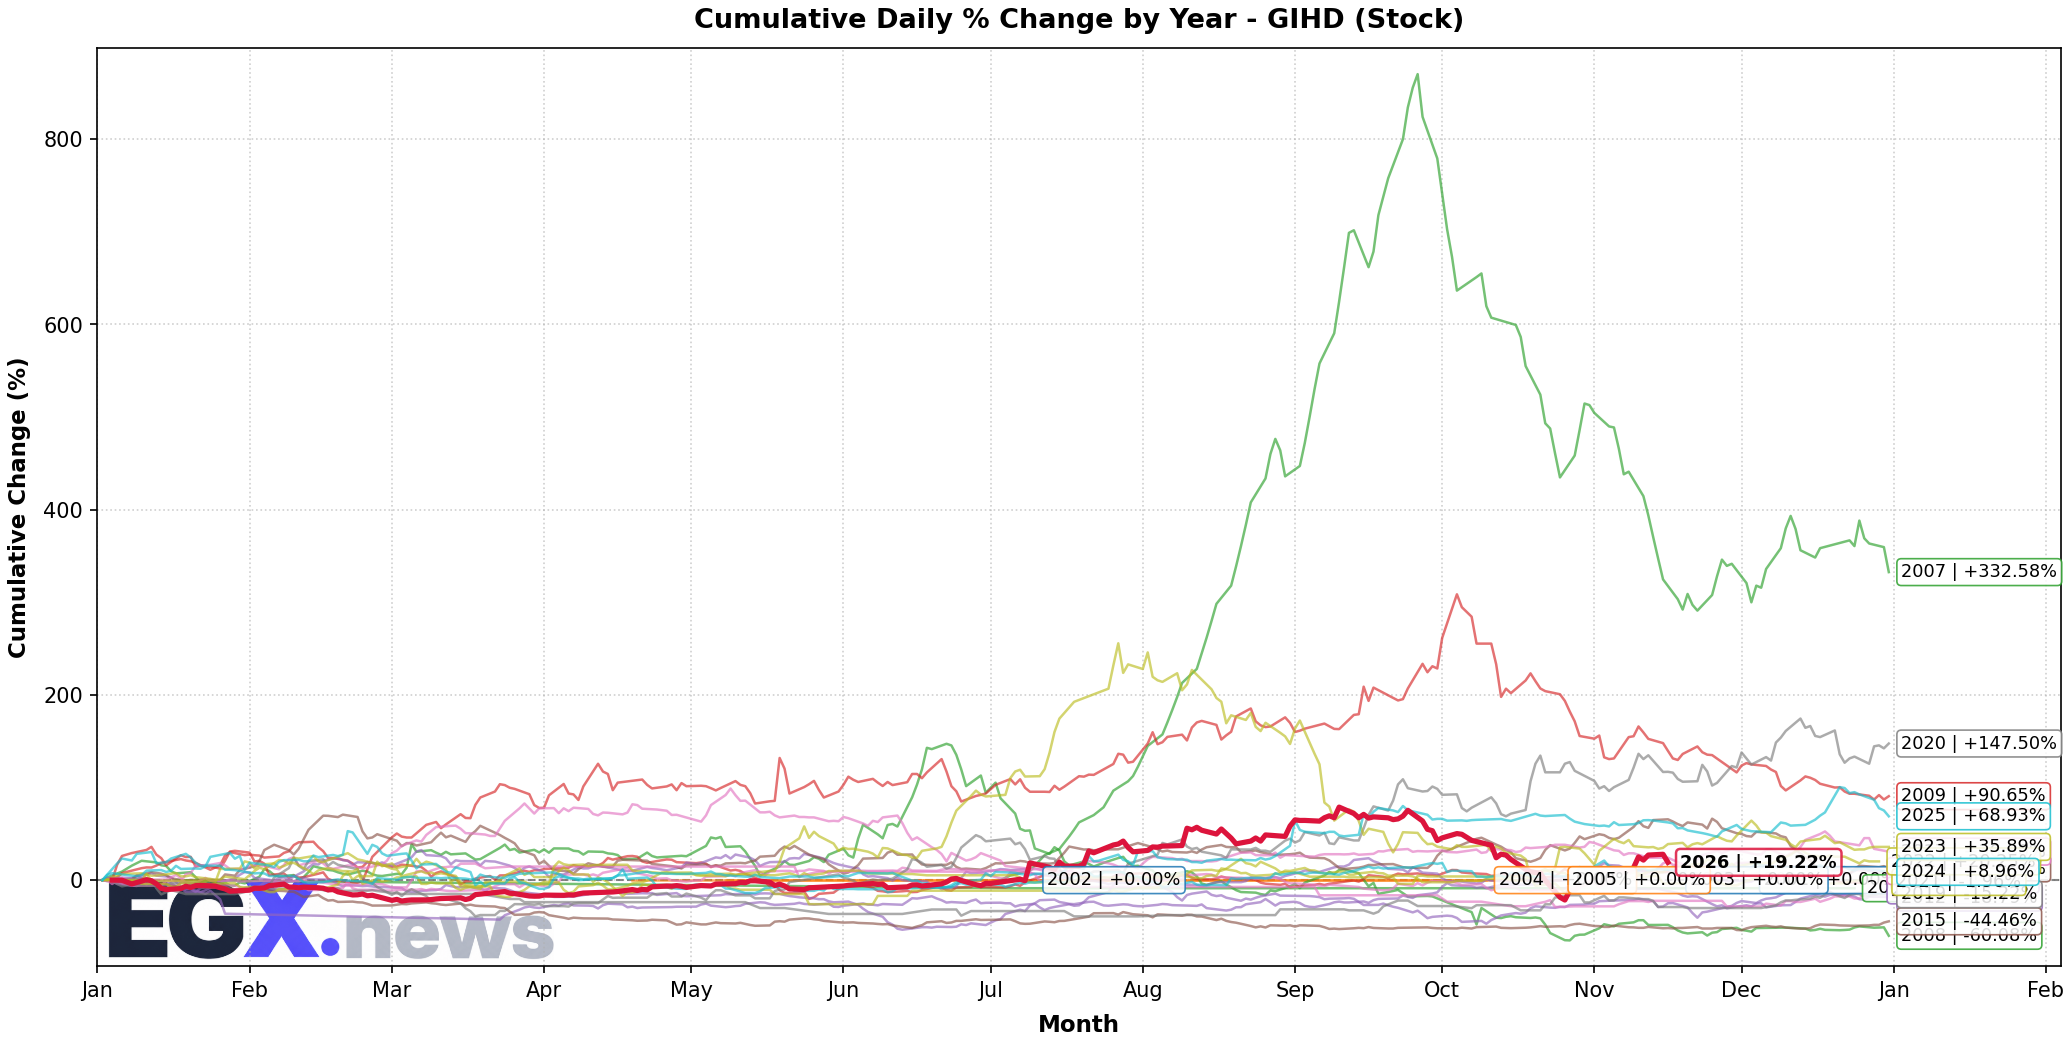
Click to EnlargeHistorical monthly seasonal return distribution and performance cycles for GIHD.
Trend Structure & Moving Averages
Golden Cross (99D)Trend Score is 50/100 with price trading 14.01% above its 20-day SMA and above the 200-day long-term benchmark (SMA50 is above SMA200 for 99 sessions).
Momentum, Volume Flow & Volatility
RSI(14) is 51.86 (Bullish Momentum), moving +1.77 over the past 5 sessions — indicating positive momentum in buyer territory. MACD line (-0.435) is above signal line (-2.558) with a histogram of +2.123 (Bullish Momentum).
20-day annualized volatility is 110.31%, ATR(14) is 4.17 (8.02% of price), and price is trading in the middle channel (%B: 0.748, Bandwidth: 56.51%).
Statistical Backtests & Historical Win Rates
BacktestedEmpirical backtesting reveals that RSI oversold dips (<30) historically yield an average 20-day return of +1.91% with a 48.54% win rate (103 observations, Reliability: High), while volume spikes yield an average 20-day return of +4.97% (54.74% win rate).
Price sits 34.93% below All-Time High (79.9 set 48 sessions ago on 2026-09-08) and 34.93% below its 52-week high (79.9 on 2026-09-08).