


GlaxoSmithKline
BIOCGlaxoSmithKline S.A.E.
Company Overview & Activities
شركة GSK هي شركة عالمية رائدة في قطاع الأدوية الحيوية، تطمح إلى توحيد جهود العلم والتكنولوجيا والمواهب لمكافحة الأمراض. وتهدف الشركة إلى إحداث تأثير إيجابي على صحة 2.5 مليار شخص خلال السنوات العشر القادمة. وتتجلى طموحات GSK الكبيرة تجاه المرضى في التزاماتها الجديدة بالنمو وتحقيق نقلة نوعية في الأداء. تُعدّ GSK مصر شركة الأدوية متعددة الجنسيات الوحيدة المدرجة في البورصة المصرية، ولها تاريخ عريق في مصر يمتد لأكثر من 100 عام. واليوم، تمتلك GSK مصر قوة عاملة متميزة تضم أكثر من 1000 فرد، بالإضافة إلى مصنعين ينتجان مئات الملايين من العبوات سنويًا، تغطي مجموعة واسعة من المنتجات التي تلبي احتياجات السوق المحلية.
EGS38171C012
1985-10-23
FRA Certified Auditor
Financial FAQ & Technical Outlook for GlaxoSmithKline S.A.E. (BIOC)
Quantitative Technical Engine (BIOC)
GlaxoSmithKline holds a Very Bullish technical posture (Overall Score: 88.0/100) with Trend Score 100/100, Momentum Score 100/100 (RSI 60.49 - Strong Bullish Momentum), and Volume Score 70/100 (accumulating, 1.21x 20D baseline).
Support & Resistance Confluence Matrix
AlgorithmicNearest support is at 385.28 [Strength: 45.0/100, Tier 3 (Intraday 1-min)] (1.26% below price with a 100.0% confirmed bounce rate across 1 tests, Reliability: Low). Nearest resistance is at 390.7 [Strength: 45.0/100, Tier 3 (Intraday 1-min)] (0.13% above price with a 100.0% confirmed rejection rate across 1 tests, Reliability: Low).
Seasonal Trend & Historical Patterns (BIOC)
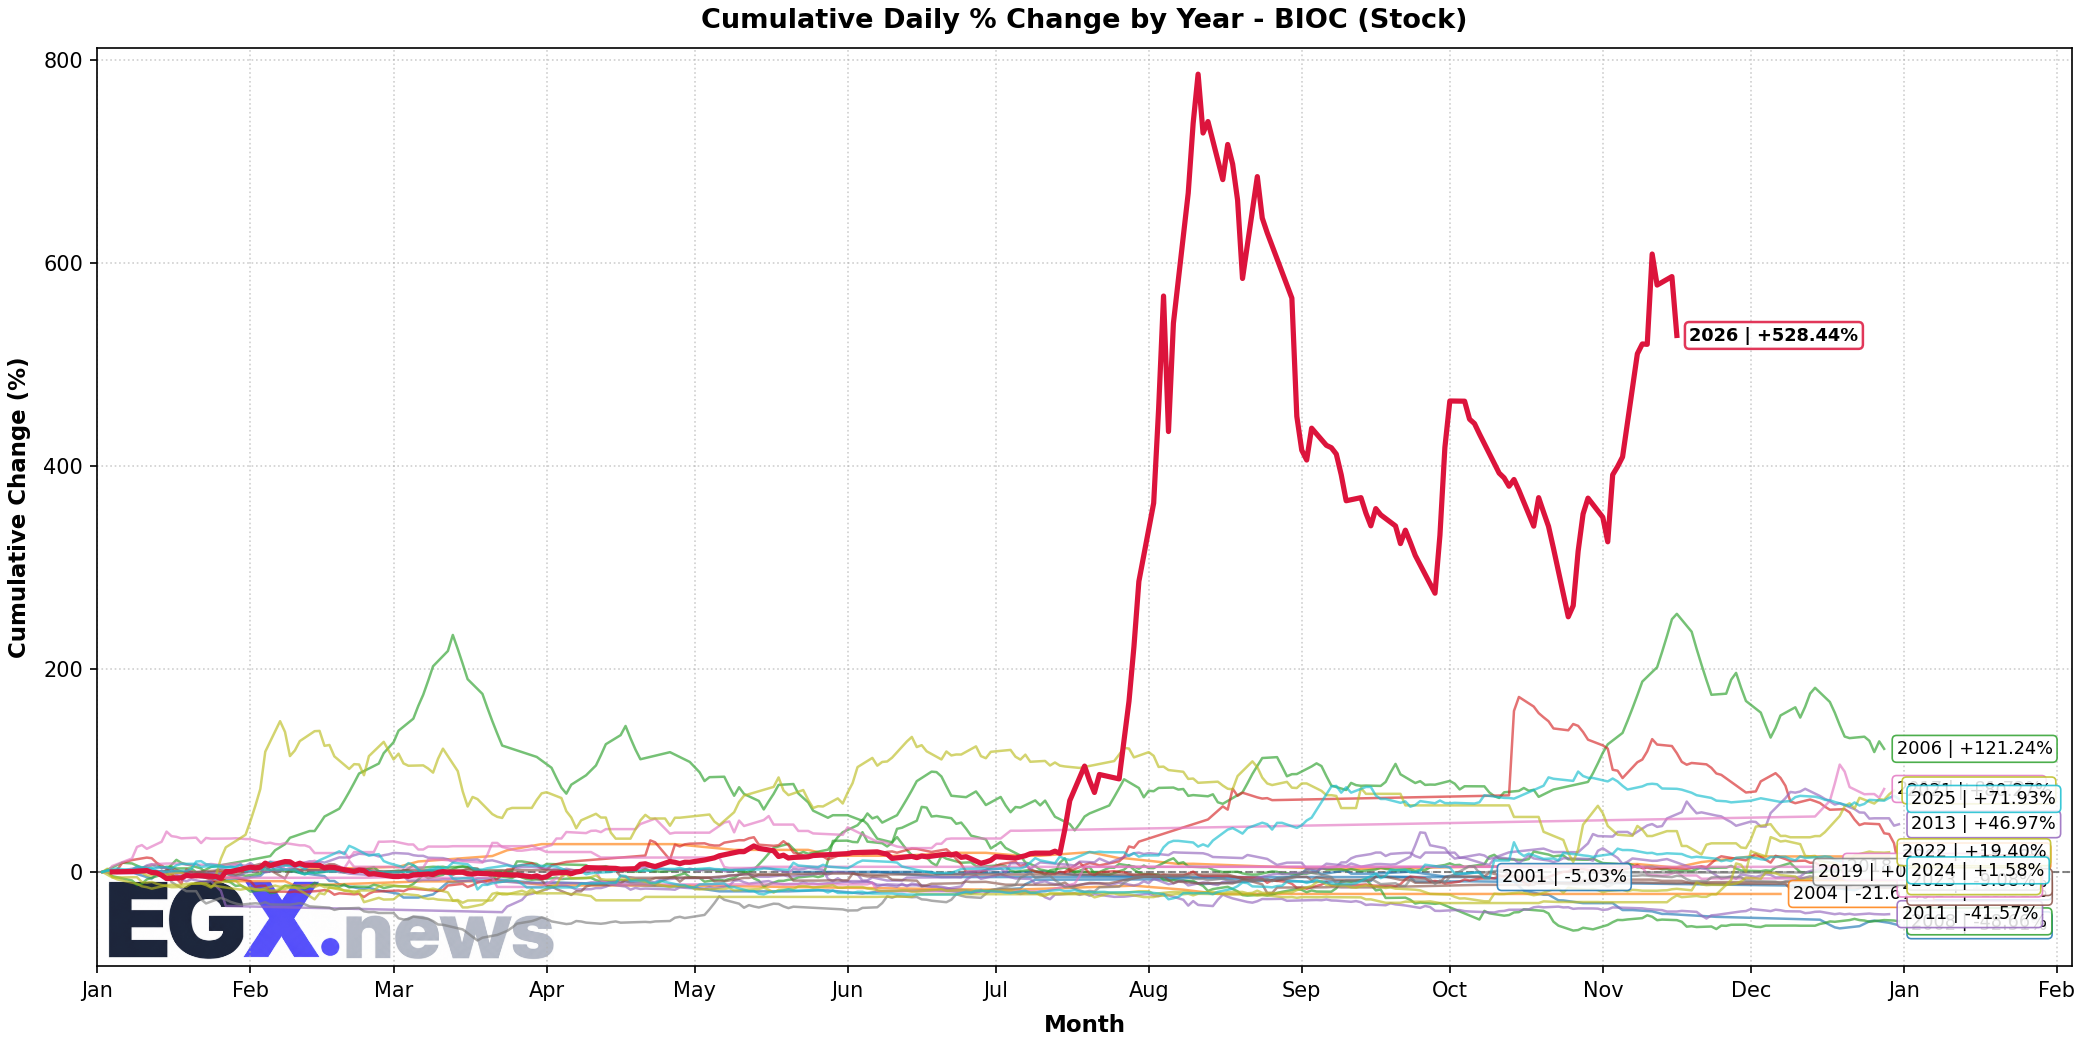
Click to EnlargeHistorical monthly seasonal return distribution and performance cycles for BIOC.
Trend Structure & Moving Averages
Golden Cross (319D)Trend Score is 100/100 with price trading 22.15% above its 20-day SMA and above the 200-day long-term benchmark (SMA50 is above SMA200 for 319 sessions).
Momentum, Volume Flow & Volatility
RSI(14) is 60.49 (Strong Bullish Momentum), moving -7.01 over the past 5 sessions — confirming powerful bullish upward pressure. MACD line (32.472) is above signal line (19.086) with a histogram of +13.386 (Bullish Momentum).
20-day annualized volatility is 143.1%, ATR(14) is 35.61 (9.13% of price), and price is trading in the middle channel (%B: 0.756, Bandwidth: 86.5%).
Statistical Backtests & Historical Win Rates
BacktestedEmpirical backtesting reveals that RSI oversold dips (<30) historically yield an average 20-day return of -1.90% with a 54.12% win rate (85 observations, Reliability: Good), while volume spikes yield an average 20-day return of +9.19% (47.77% win rate).
Price sits 35.93% below All-Time High (609.0 set 67 sessions ago on 2026-08-11) and 35.93% below its 52-week high (609.0 on 2026-08-11).