


Gogreen
GGRNGogreen for Agricultural Investment and Development Company
Company Overview & Activities
استصلاح وتجهيز الأراضي بالمرافق الأساسية التي تجعلها قابلة للاستزراع واستزراع الأراضي المستصلحة (أكثر من عشرين ألف فدان) ويشترط في هاتين الحالتين أن تكون الأراضي مخصصة لأغراض الاستصلاح والاستزراع، وأن تستخدم طرق الري الحديثة وليس الري بطريق الغمر، إقامة وتشغيل مصنع لتصنيع زيوت الجوجوبا وتعبئة الزيوت، فرز وتجهيز وتعبئة وتغليف المواد الغذائية، تربية جميع أنواع الحيوانات سواء كان لإنتاج السلالات أو الألبان أو التسمين أو اللحوم، تربية جميع أنواع الدواجن والطيور سواء كان ذلك لإنتاج السلالات أو التفريغ أو إنتاج البيض أو التسمين أو اللحوم، إقامة المزارع السمكية وكذا صيد الأسماك، إقامة وتشغيل الفنادق (الثابتة) والموتيلات والشقق والأجنحة الفندقية والقرى السياحية بمستوى لا يقل عن ثلاث نجوم والأنشطة المكملة أو المرتبطة بها من خدمية وترفيهية ورياضية وتجارية وثقافية، الاستيراد والتصدير، إقامة وتشغيل مخازن لتخزين البضائع، إقامة وتشغيل ثلاجات لحفظ الحاصلات الزراعية والمنتجات الصناعية والمواد الغذائية وتبريدها أو تجميدها، التجارة العامة والتوزيع فيما هو مسموح به قانونًا، إنشاء وإدارة المدارس الخاصة في
EGS07DR1C012
2024-07-17
FRA Certified Auditor
Financial FAQ & Technical Outlook for Gogreen for Agricultural Investment and Development Company (GGRN)
Quantitative Technical Engine (GGRN)
Gogreen holds a Bearish technical posture (Overall Score: 32.5/100) with Trend Score 0/100, Momentum Score 70/100 (RSI 37.49 - Bearish Momentum), and Volume Score 35/100 (distributing, 1.41x 20D baseline).
Support & Resistance Confluence Matrix
AlgorithmicNearest support is at 1.0 [Strength: 82.5/100, Tier 1 (Macro 500D)] (1.96% below price with a 90.0% confirmed bounce rate across 20 tests, Reliability: High). Nearest resistance is at 1.03 [Strength: 45.0/100, Tier 3 (Intraday 1-min)] (0.98% above price with a 100.0% confirmed rejection rate across 1 tests, Reliability: Low).
Seasonal Trend & Historical Patterns (GGRN)
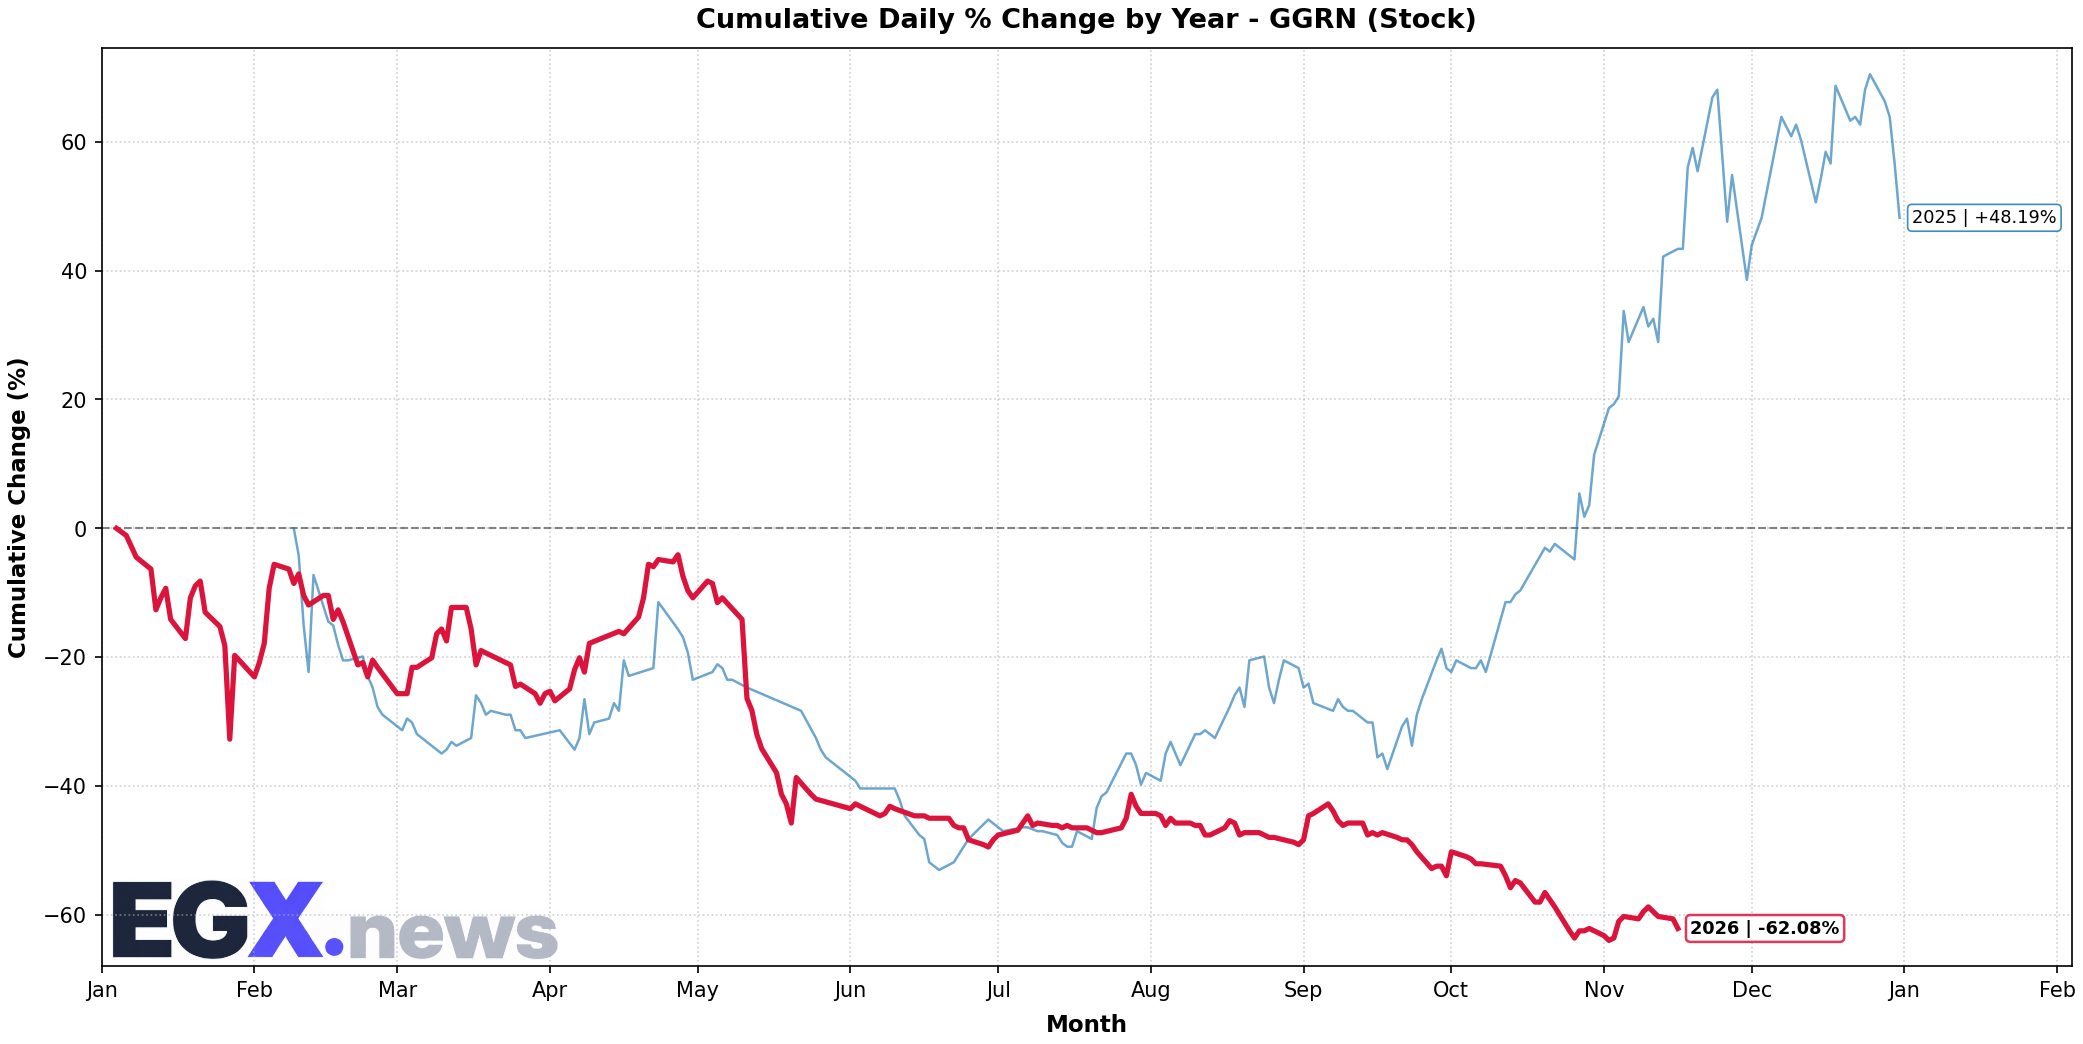
Click to EnlargeHistorical monthly seasonal return distribution and performance cycles for GGRN.
Trend Structure & Moving Averages
Trend Score is 0/100 with price trading 2.86% below its 20-day SMA and below the 200-day long-term benchmark (SMA50 is below SMA200).
Momentum, Volume Flow & Volatility
RSI(14) is 37.49 (Bearish Momentum), moving -7.95 over the past 5 sessions — reflecting persistent selling pressure. MACD line (-0.042) is above signal line (-0.055) with a histogram of +0.013 (Bullish Momentum).
20-day annualized volatility is 54.59%, ATR(14) is 0.05 (4.9% of price), and price is trading in the middle channel (%B: 0.364, Bandwidth: 20.95%).
Statistical Backtests & Historical Win Rates
BacktestedEmpirical backtesting reveals that RSI oversold dips (<30) historically yield an average 20-day return of -3.65% with a 29.41% win rate (17 observations, Reliability: Low), while volume spikes yield an average 20-day return of +1.58% (42.11% win rate).
Price sits 64.21% below All-Time High (2.85 set 208 sessions ago on 2025-12-25) and 64.21% below its 52-week high (2.85 on 2025-12-25).