


Golden Textiles & Clothes Wool
GTWLGolden Textiles & Clothes Wool
Company Overview & Activities
غرض الشركة هو غزل و نسيج و تجهيز و صباغة الاقمشة الصوفية المخلوطه بانواعها و البوليستر بانواعها الخالص و المخلوط و الالياف التركيبية المستخدمة في النسيج و التريكو و صباغة التوبس و الغزل و تجارة الغزل و التوبس و تشميع الخيوط البوليستر و خيوط صناعيه غير مستمره سواء من انتاج الشركة او الغير و تصنيع و تخزين المنتجات التالية القطن ، القطن المخلوط الاكليرك ، الفسكوز ، الليكرا ، الكشمير ، النايلون ، الحرير والكتان بجميع خلطاتها و تصنيع الاقمشمة و الغزول من تلك المنتجات ، و يجوز للشركة ان تكون لها مصلحه او تشترك باى وجه من الوجوه مع الهيئات و غيرها التي تزاول اعمالا شبيهه باعمالها او التي تعاونها على تحقيق غرضها في مصر او في الخارج كما يجوز لها ان تندمج في الهيئات السابقة او تشتريها او تلحقها بها بموافقة الهيئة العامة للاستثمار و المناطق الحرة
EGS32161C019
1992-04-07
FRA Certified Auditor
Financial FAQ & Technical Outlook for Golden Textiles & Clothes Wool (GTWL)
Quantitative Technical Engine (GTWL)
Golden Textiles & Clothes Wool holds a Bullish technical posture (Overall Score: 72.0/100) with Trend Score 50/100, Momentum Score 90/100 (RSI 50.91 - Bullish Momentum), and Volume Score 70/100 (accumulating, 0.86x 20D baseline).
Support & Resistance Confluence Matrix
AlgorithmicNearest support is at 138.03 [Strength: 45.0/100, Tier 3 (Intraday 1-min)] (0.7% below price with a 100.0% confirmed bounce rate across 1 tests, Reliability: Low). Nearest resistance is at 140.13 [Strength: 45.0/100, Tier 3 (Intraday 1-min)] (0.81% above price with a 100.0% confirmed rejection rate across 1 tests, Reliability: Low).
Seasonal Trend & Historical Patterns (GTWL)
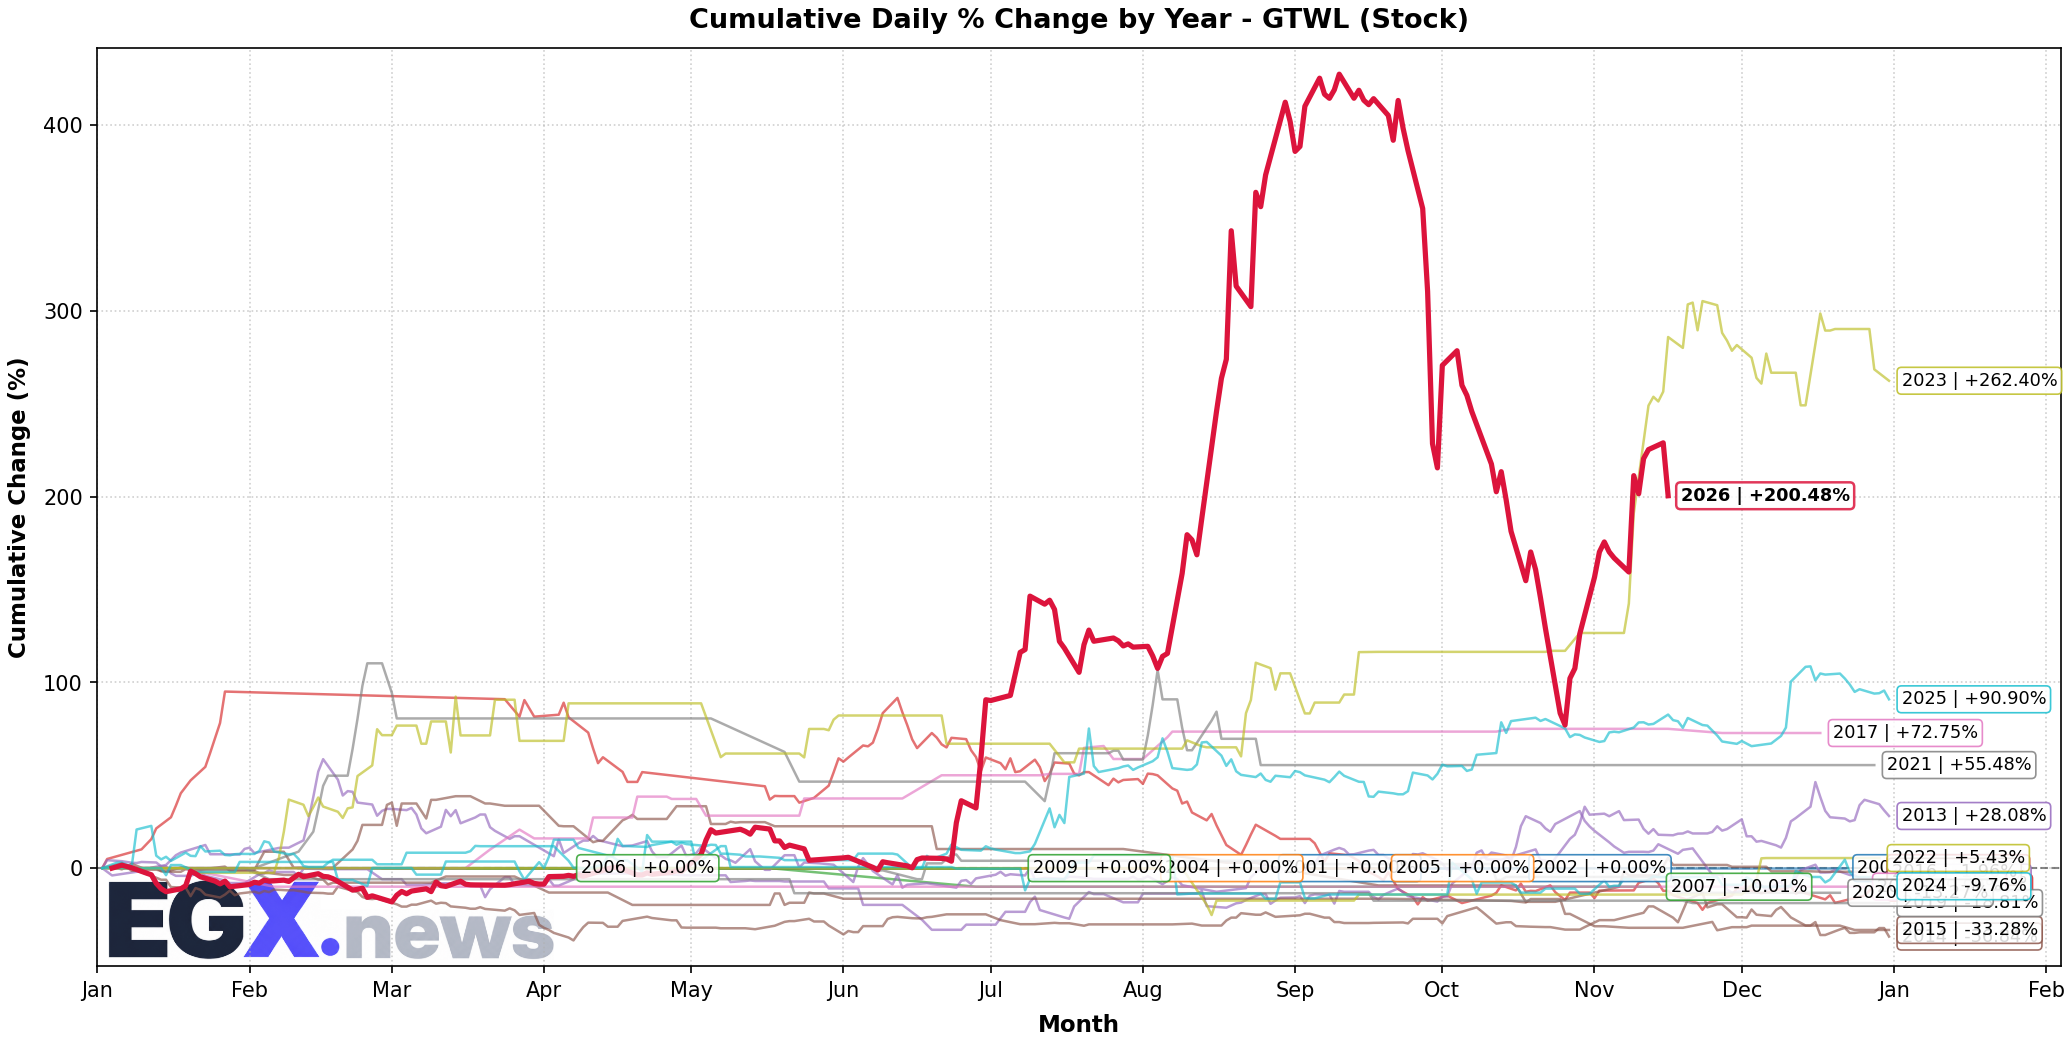
Click to EnlargeHistorical monthly seasonal return distribution and performance cycles for GTWL.
Trend Structure & Moving Averages
Golden Cross (410D)Trend Score is 50/100 with price trading 15.15% above its 20-day SMA and above the 200-day long-term benchmark (SMA50 is above SMA200 for 410 sessions).
Momentum, Volume Flow & Volatility
RSI(14) is 50.91 (Bullish Momentum), moving -4.04 over the past 5 sessions — indicating positive momentum in buyer territory. MACD line (-0.931) is above signal line (-7.296) with a histogram of +6.365 (Bullish Momentum).
20-day annualized volatility is 142.38%, ATR(14) is 15.4 (11.08% of price), and price is trading in the middle channel (%B: 0.714, Bandwidth: 70.62%).
Statistical Backtests & Historical Win Rates
BacktestedEmpirical backtesting reveals that RSI oversold dips (<30) historically yield an average 20-day return of +5.31% with a 42.86% win rate (91 observations, Reliability: Good), while volume spikes yield an average 20-day return of +7.38% (50.86% win rate).
Price sits 84.7% below All-Time High (908.64 set 2436 sessions ago on 2001-07-18) and 44.14% below its 52-week high (248.84 on 2026-09-06).