


Heibco Npv
HBCOHeibco Npv
Company Overview & Activities
أنشطة البناء للإسكان العائلي والإداري والتجاري المقاولات العامة والمتخصصة والمتكاملة شراء وبيع وتأجير وامتلاك الأراضي بهدف تقسيمها وتخطيطها ومدها بالمرافق وإعدادها للبناء، أو بيعها بحالتها أو بعد إقامة المنشآت عليها وإقامة المباني والوحدات السكنية والتجارية والإدارية والترفيهيه لتمليكها أو تأجيرها أو إدارتها أو استغلالها لحسابها أو لحساب الغير تجهيز الأراضي بمرافق البنية الأساسية (مياه / صرف صحي / كهرباء / تليفونات / طرق) واستغلالها بالتمليك أو الإيجار وتنسيق الحدائق والطرق والميادين، الاستيراد والتصدير، الاستثمار العقاري إعداد التصميمات الهندسية إدارة الأصول العقارية، التجارة العامة والتوزيع فيما هو مسموح به قانونًا وذلك دون الإخلال بأحكام القوانين واللوائح والقرارات السارية وبشرط استصدار التراخيص اللازمة لممارسة هذه الأنشطة، مع مراعاة أحكام القوانين والقرارات السارية بشرط استصدار التراخيص اللازمة لممارسة هذه الأنشطة، ويجوز للشركة أن تكون لها مصلحة أو تشترك بأي وجه من الوجوه مع الشركات وغيرها التي تزاول أعمالاً شبيهه بأعمالها أو التي قد تعاونها على تحقيق غرضها في مصر أو الخارج
EGS23OD1C015
Listed on EGX
FRA Certified Auditor
Financial FAQ & Technical Outlook for Heibco Npv (HBCO)
Quantitative Technical Engine (HBCO)
Heibco Npv holds a Bullish technical posture (Overall Score: 75.0/100) with Trend Score 50/100, Momentum Score 100/100 (RSI 58.91 - Bullish Momentum), and Volume Score 70/100 (accumulating, 0.52x 20D baseline).
Support & Resistance Confluence Matrix
AlgorithmicNearest support is at 9.67 [Strength: 45.0/100, Tier 3 (Intraday 1-min)] (1.53% below price with a 100.0% confirmed bounce rate across 1 tests, Reliability: Low). Nearest resistance is at 10.0 [Strength: 45.0/100, Tier 3 (Intraday 1-min)] (1.83% above price with a 100.0% confirmed rejection rate across 1 tests, Reliability: Low).
Seasonal Trend & Historical Patterns (HBCO)
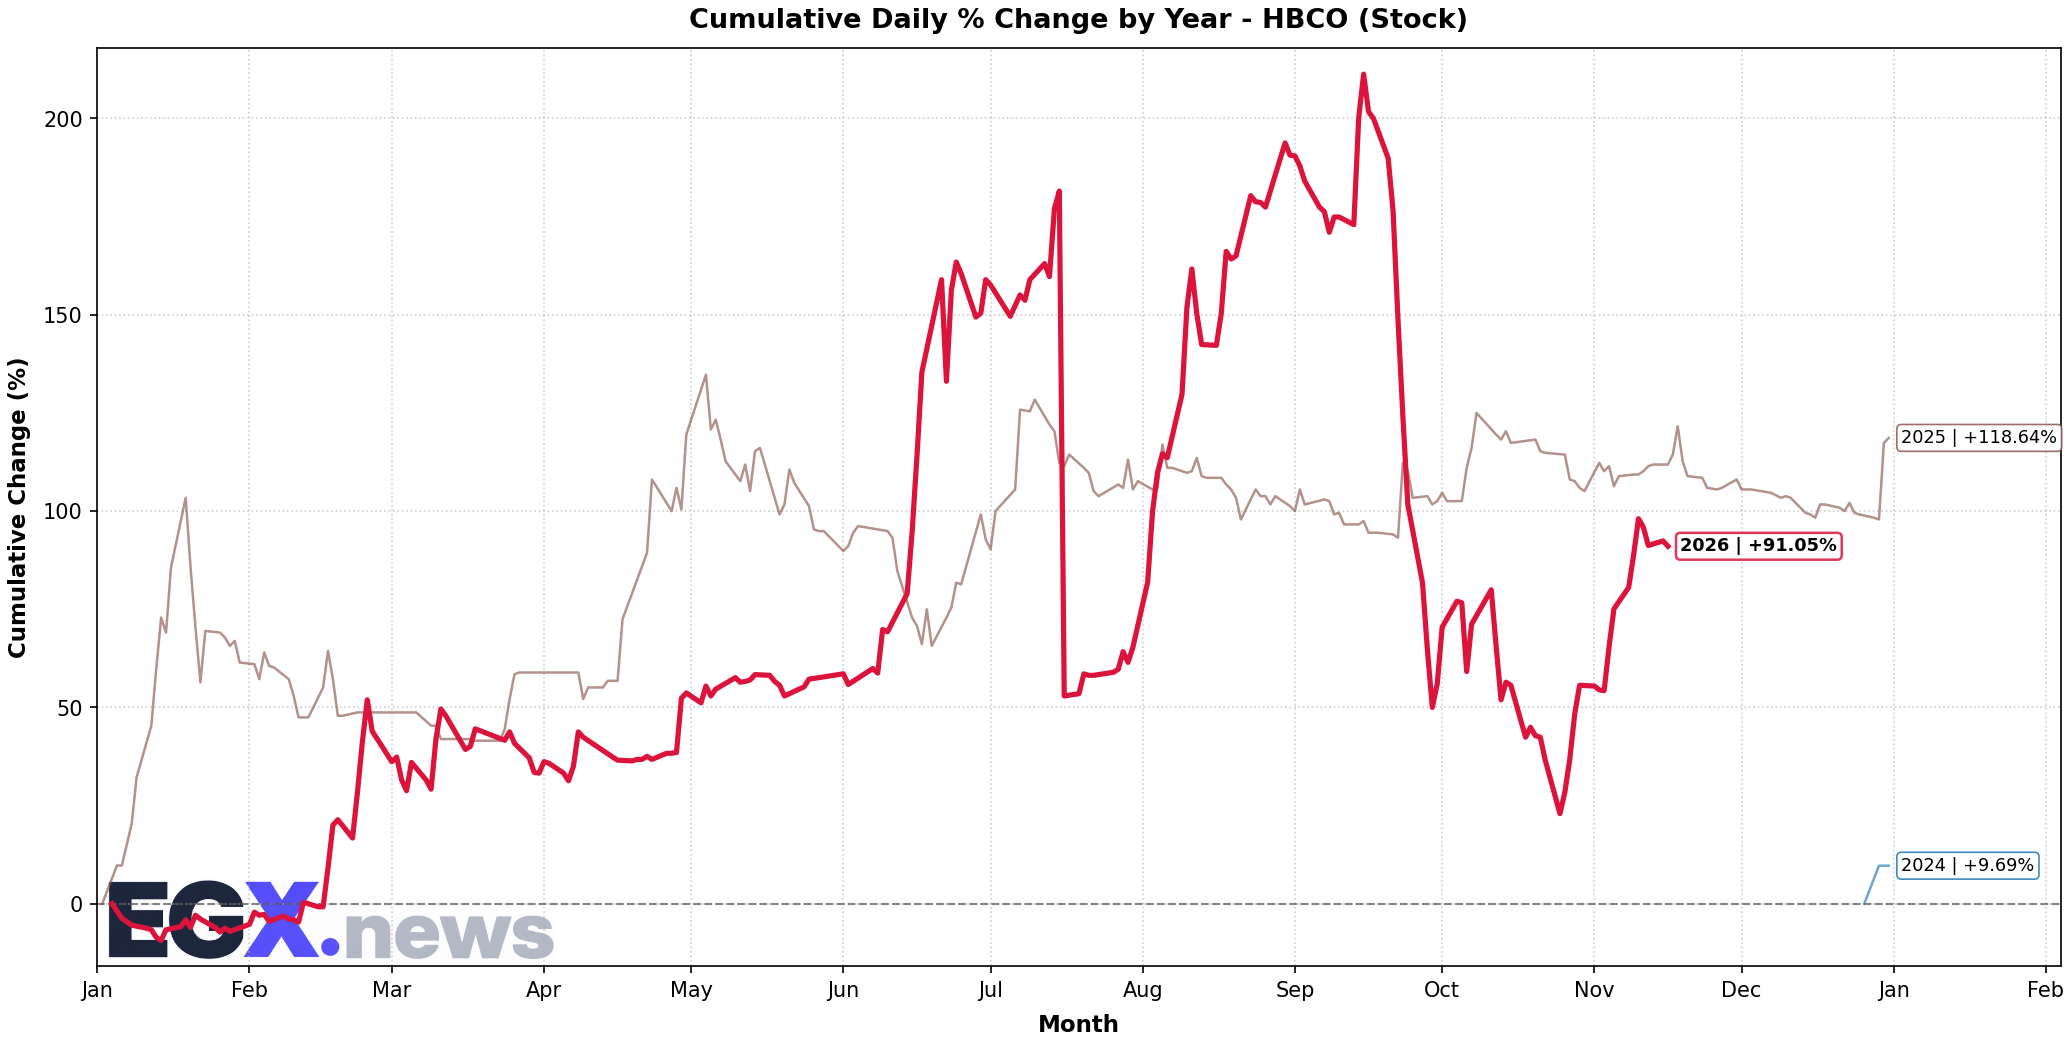
Click to EnlargeHistorical monthly seasonal return distribution and performance cycles for HBCO.
Trend Structure & Moving Averages
Golden Cross (262D)Trend Score is 50/100 with price trading 17.32% above its 20-day SMA and above the 200-day long-term benchmark (SMA50 is below SMA200).
Momentum, Volume Flow & Volatility
RSI(14) is 58.91 (Bullish Momentum), moving -1.23 over the past 5 sessions — indicating positive momentum in buyer territory. MACD line (0.219) is above signal line (-0.124) with a histogram of +0.342 (Bullish Momentum).
20-day annualized volatility is 71.06%, ATR(14) is 0.69 (7.03% of price), and price is trading in the middle channel (%B: 0.789, Bandwidth: 60.1%).
Statistical Backtests & Historical Win Rates
BacktestedEmpirical backtesting reveals that RSI oversold dips (<30) historically yield an average 20-day return of -23.92% with a 0.0% win rate (2 observations, Reliability: Very Low), while volume spikes yield an average 20-day return of +3.73% (44.0% win rate).
Price sits 42.13% below All-Time High (16.97 set 43 sessions ago on 2026-09-15) and 42.13% below its 52-week high (16.97 on 2026-09-15).