


Industrial
ENGCIndustrial Engineering Co. for Construction & Development
Company Overview & Activities
صناعة وتجارة الآلات والمعدات والمركبات والمواد المعمارية والقيام بالأعمال التجارية والتوكيلات واعمال الاستيراد والتصدير اللازمة لمباشرة غرضها .... تصنيع: 1. قطاعات حديد ملونة ومجلفنة وسوداء. 2. صاج معرج ملون ومجلفن. 3. ساندوتش بانلز. 4. باب وشباك الومنيوم. 5. وحدات اعاشة متنقلة وسابقة التجهيز (كرافانات). 6. مواسير حديد أطوال وأقطار مختلفة مجلفنة وسوداء. بشرط استصدار التراخيص اللازمة لممارسة هذه الانشطة. الإستثمار والمساهمة والاشتراك بصورة مباشرة وغير مباشرة في الشركات التي تعمل في كافة المجالات والأنشطة الصناعية والإنشاءات الهندسية. الإشتراك والمساهمة في الشركات التي تعمل في المجالات السابقة أو التي تزاول أعمال شبيهه بأعمالها او التي قد تعاونها على تحقيق غرضها في مصر او في الخارج، كما يجوز لها أن تندمج فيها أو تشتريها أو تلحقها بها وذلك طبقاً لأحكام القانون. وكل ما سبق فيما عدا الأنشطة المنصوص عليها بالمادة (27) من قانون سوق رأس المال رقم 95 لسنة 1992 والمادتين (120) و (122) من اللائحه التنفيذية لذات القانون.
EGS3F021C017
1982-02-19
FRA Certified Auditor
Financial FAQ & Technical Outlook for Industrial Engineering Co. for Construction & Development (ENGC)
Quantitative Technical Engine (ENGC)
Industrial holds a Bullish technical posture (Overall Score: 70.8/100) with Trend Score 65/100, Momentum Score 100/100 (RSI 58.75 - Bullish Momentum), and Volume Score 45/100 (accumulating, 2.93x 20D baseline).
Support & Resistance Confluence Matrix
AlgorithmicNearest support is at 39.77 [Strength: 45.0/100, Tier 3 (Intraday 1-min)] (0.6% below price with a 100.0% confirmed bounce rate across 1 tests, Reliability: Low). Nearest resistance is at 40.28 [Strength: 45.0/100, Tier 3 (Intraday 1-min)] (0.67% above price with a 100.0% confirmed rejection rate across 1 tests, Reliability: Low).
Seasonal Trend & Historical Patterns (ENGC)
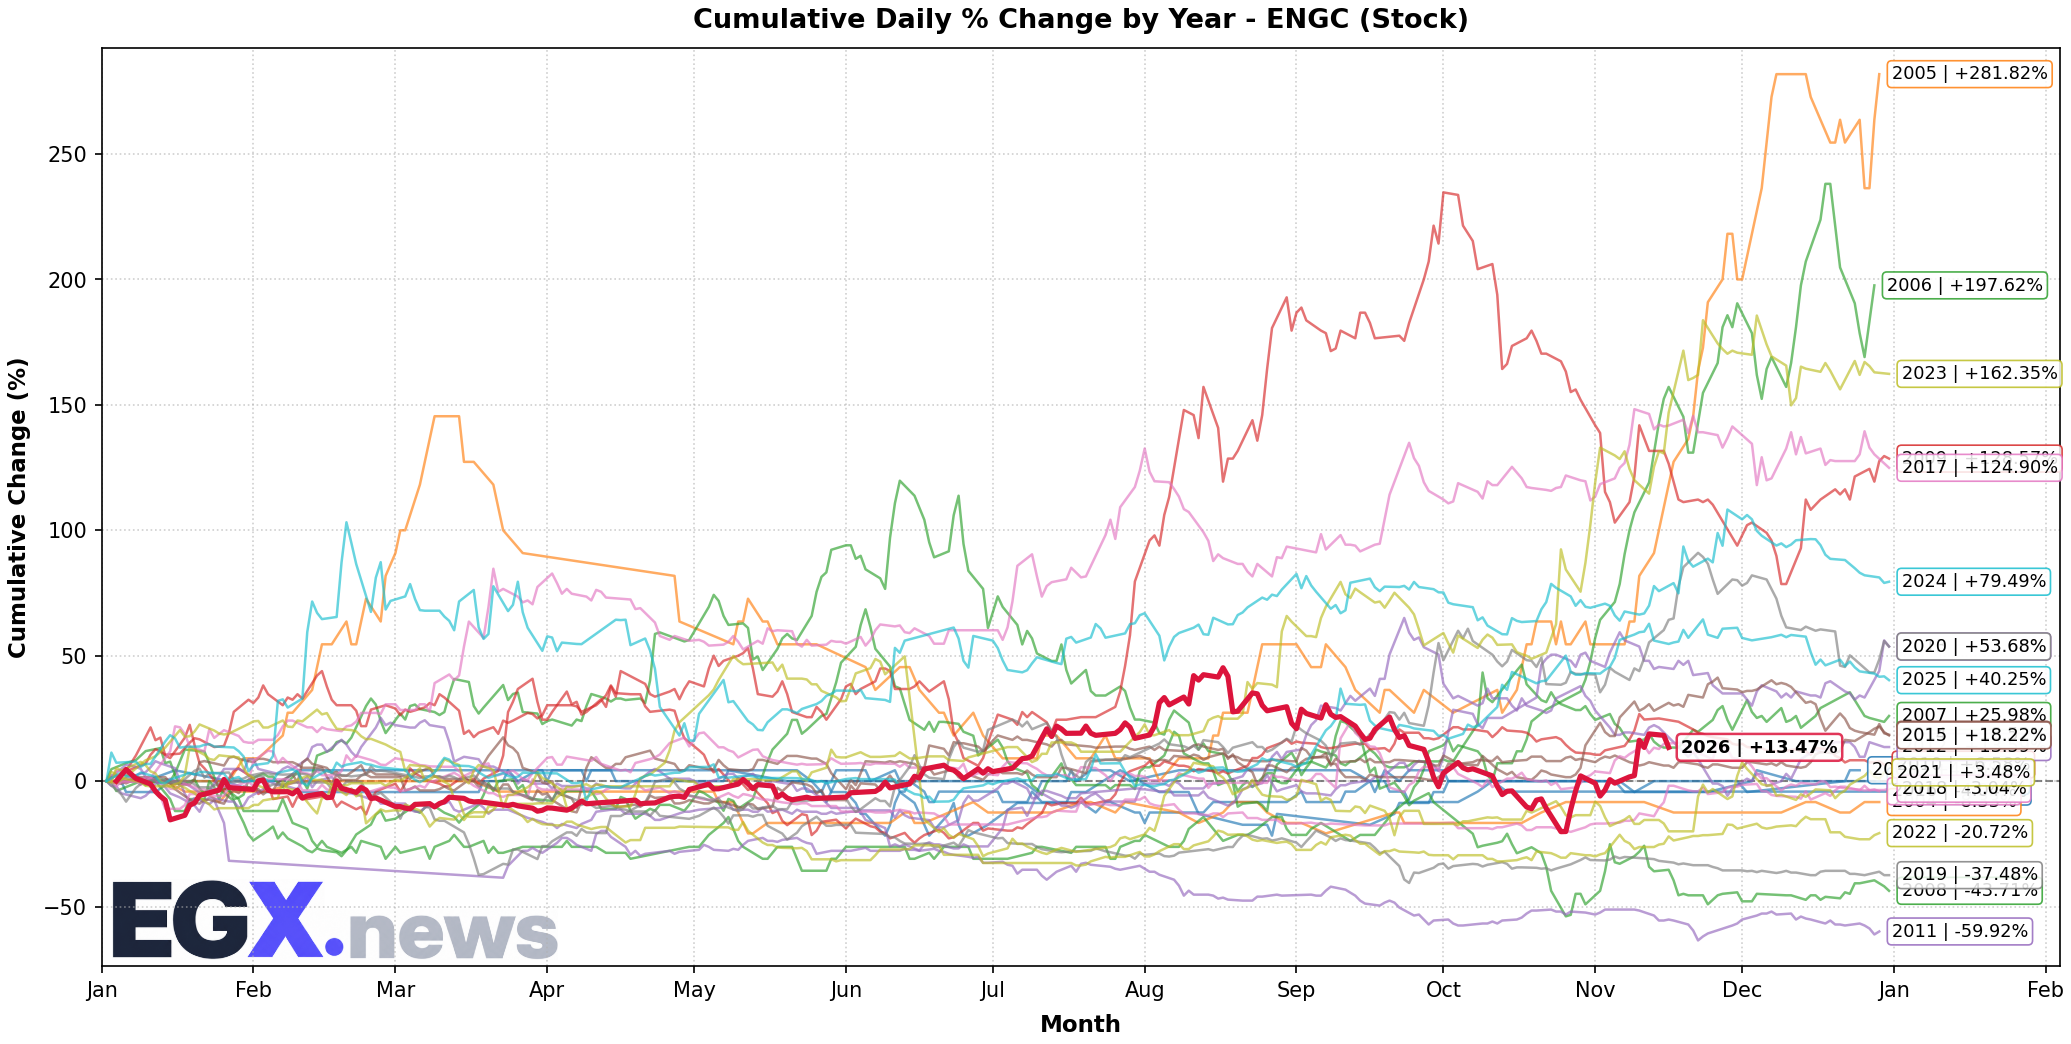
Click to EnlargeHistorical monthly seasonal return distribution and performance cycles for ENGC.
Trend Structure & Moving Averages
Golden Cross (284D)Trend Score is 65/100 with price trading 13.76% above its 20-day SMA and above the 200-day long-term benchmark (SMA50 is above SMA200 for 284 sessions).
Momentum, Volume Flow & Volatility
RSI(14) is 58.75 (Bullish Momentum), moving +5.41 over the past 5 sessions — indicating positive momentum in buyer territory. MACD line (1.262) is above signal line (0.187) with a histogram of +1.075 (Bullish Momentum).
20-day annualized volatility is 91.73%, ATR(14) is 2.37 (5.92% of price), and price is trading in the middle channel (%B: 0.796, Bandwidth: 46.52%).
Statistical Backtests & Historical Win Rates
BacktestedEmpirical backtesting reveals that RSI oversold dips (<30) historically yield an average 20-day return of +6.13% with a 59.09% win rate (88 observations, Reliability: Good), while volume spikes yield an average 20-day return of +3.49% (49.71% win rate).
Price sits 26.98% below All-Time High (54.79 set 63 sessions ago on 2026-08-17) and 26.98% below its 52-week high (54.79 on 2026-08-17).