


Industrial & Engineering Enterprises
IEECIndustrial & Engineering Enterprises Co.
Company Overview & Activities
القيام بجميع أعمال المقاولات العمومية وعلي الأخص الانشاءات المدنية وتوريد وتركيب المهمات الميكانيكية والكهربائية لعمليات الصرف الصحي ومحطات مياه الشرب والري واستصلاح الأراضي والاراضي ومحطات القوي والمصانع وخطوط المياه والصرف الصحي والبترول ومحطات تحلية المياه وأعمال الطرق والرصف والاستثمار العقاري بما في من شراء الأراضي واتخاذ إجراءات تقسيمها وانشاء الوحدات الإدارية او السكنية ..................... ، القيام بتأجير الأصول الثابتة بجميع أنواعها للغير العقارات والأراضي والشقق والالات والمعدات والسيارات المملوكة للشركة وذلك بغرض استغلال الطاقات غير المستغلة ................... الخ .
EGS22171C010
1997-07-15
FRA Certified Auditor
Financial FAQ & Technical Outlook for Industrial & Engineering Enterprises Co. (IEEC)
Quantitative Technical Engine (IEEC)
Industrial & Engineering Enterprises holds a Neutral technical posture (Overall Score: 41.8/100) with Trend Score 35/100, Momentum Score 60/100 (RSI 42.57 - Neutral), and Volume Score 35/100 (distributing, 1.21x 20D baseline).
Support & Resistance Confluence Matrix
AlgorithmicNearest support is at 0.67 [Strength: 65.0/100, Tier 3 (Intraday 1-min)] (1.47% below price with a 100.0% confirmed bounce rate across 348 tests, Reliability: High). Nearest resistance is at 0.69 [Strength: 45.0/100, Tier 3 (Intraday 1-min)] (1.47% above price with a 100.0% confirmed rejection rate across 1 tests, Reliability: Low).
Seasonal Trend & Historical Patterns (IEEC)
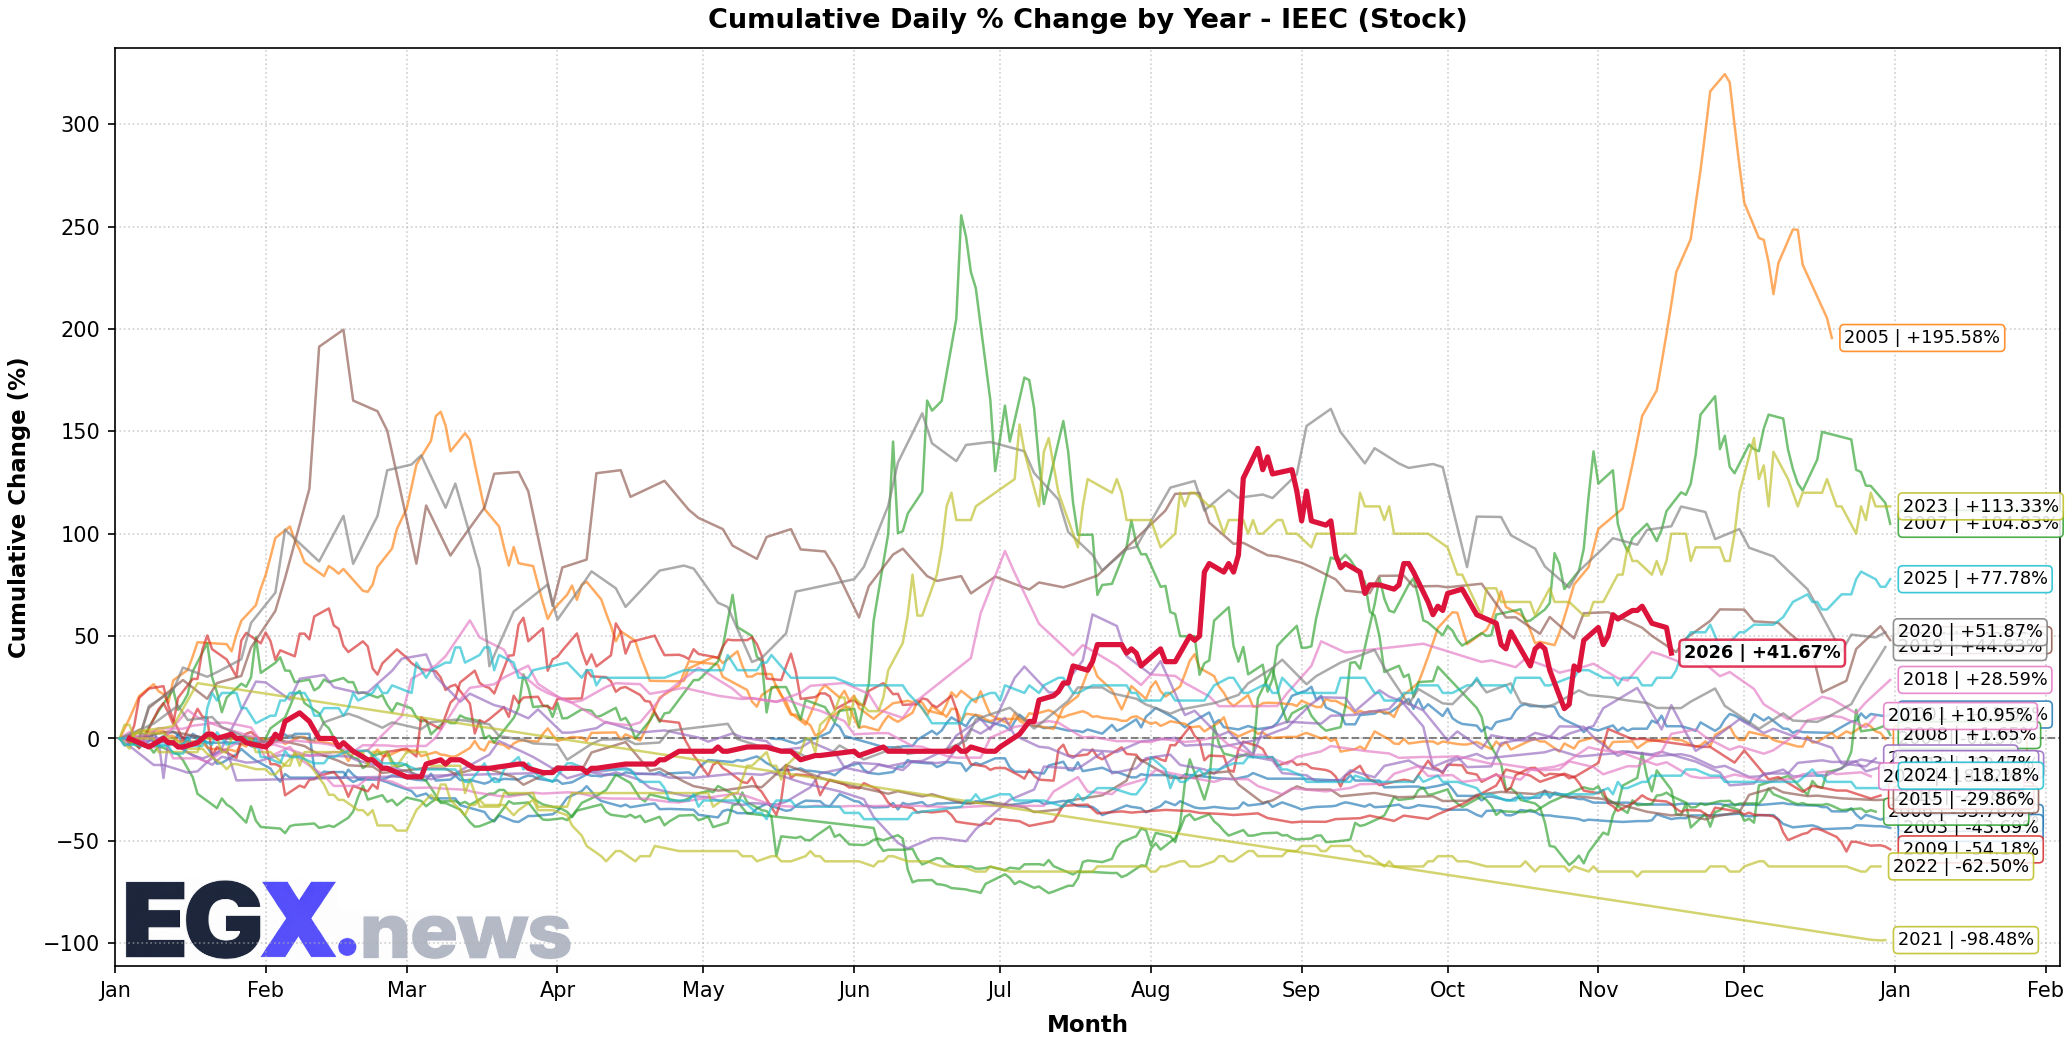
Click to EnlargeHistorical monthly seasonal return distribution and performance cycles for IEEC.
Trend Structure & Moving Averages
Golden Cross (446D)Trend Score is 35/100 with price trading 4.23% below its 20-day SMA and above the 200-day long-term benchmark (SMA50 is above SMA200 for 446 sessions).
Momentum, Volume Flow & Volatility
RSI(14) is 42.57 (Neutral), moving -13.17 over the past 5 sessions — indicating a balanced / consolidation posture. MACD line (-0.002) is above signal line (-0.006) with a histogram of +0.005 (Bullish Momentum).
20-day annualized volatility is 105.05%, ATR(14) is 0.05 (7.35% of price), and price is trading in the middle channel (%B: 0.393, Bandwidth: 39.44%).
Statistical Backtests & Historical Win Rates
BacktestedEmpirical backtesting reveals that RSI oversold dips (<30) historically yield an average 20-day return of +1.83% with a 42.86% win rate (84 observations, Reliability: Good), while volume spikes yield an average 20-day return of +3.57% (42.68% win rate).
Price sits 99.12% below All-Time High (77.0 set 2674 sessions ago on 2008-06-24) and 47.29% below its 52-week high (1.29 on 2026-08-23).