


Integrated Engineering
INEGIntegrated Engineering Group S.A.E
Company Overview & Activities
1- إدارة مشروعات و الشركات و الاشتراك في ادارتها . مع مراعاة احكام القوانين و اللوائح و القرارات السارية و بشرط استصدار التراخيص اللازمة اممارسة هذه الأنشطة . 2- القيام باعمال التكيبات الميكانيكية و الكهروميكانيكية و التركيبات المعدنية المتنقلة بكافة انوعها . 3- القيام باعمال مقاولات البناء و التشييد و التشطيبات و الدهنات و العزل . 4- القيام باعمال تدريب العمالة و توريد المعدات و الخامات و كافة المستلزمات المتعلقة بكافة النشطة السابقة . 5- أعمال الاستشارات و التصميمات الهندسية . 6- القيام باعمال الفتيش الهندسي و مراقبة الجودة و ما يستلزمها من اختبارات متعلقة بكافة الانشطة السابقة . 7- القيام بعقد دورا تدريبية في المجالات الهندسية و الفنية المختلفة و ما يلزمها من عقد الاختبارات و منح شهادة الكفاءة . 8- تجارة و توزيع كافة السلع و الخامات و مواد البناء و قبول التوكيلات التجارية في كافة المجالات . 9- الاستيراد و التصدير 10- الاشتراك و المساهمة و الاستثمار بصورة مباشرة و غير مباشرة في كافة مجالات الاستثمار الخدمية و التجارية و الصناعية مع عدم الاخلال بالمادة 27 من قانون سوق
EGS3E3B1C014
Listed on EGX
FRA Certified Auditor
Financial FAQ & Technical Outlook for Integrated Engineering Group S.A.E (INEG)
Quantitative Technical Engine (INEG)
Integrated Engineering holds a Bullish technical posture (Overall Score: 62.8/100) with Trend Score 65/100, Momentum Score 80/100 (RSI 49.84 - Neutral), and Volume Score 35/100 (distributing, 1.05x 20D baseline).
Support & Resistance Confluence Matrix
AlgorithmicNearest support is at 0.56 [Strength: 45.0/100, Tier 3 (Intraday 1-min)] (1.75% below price with a 100.0% confirmed bounce rate across 1 tests, Reliability: Low). Nearest resistance is at 0.58 [Strength: 81.9/100, Tier 1 (Macro 500D)] (1.75% above price with a 87.5% confirmed rejection rate across 8 tests, Reliability: Moderate).
Seasonal Trend & Historical Patterns (INEG)
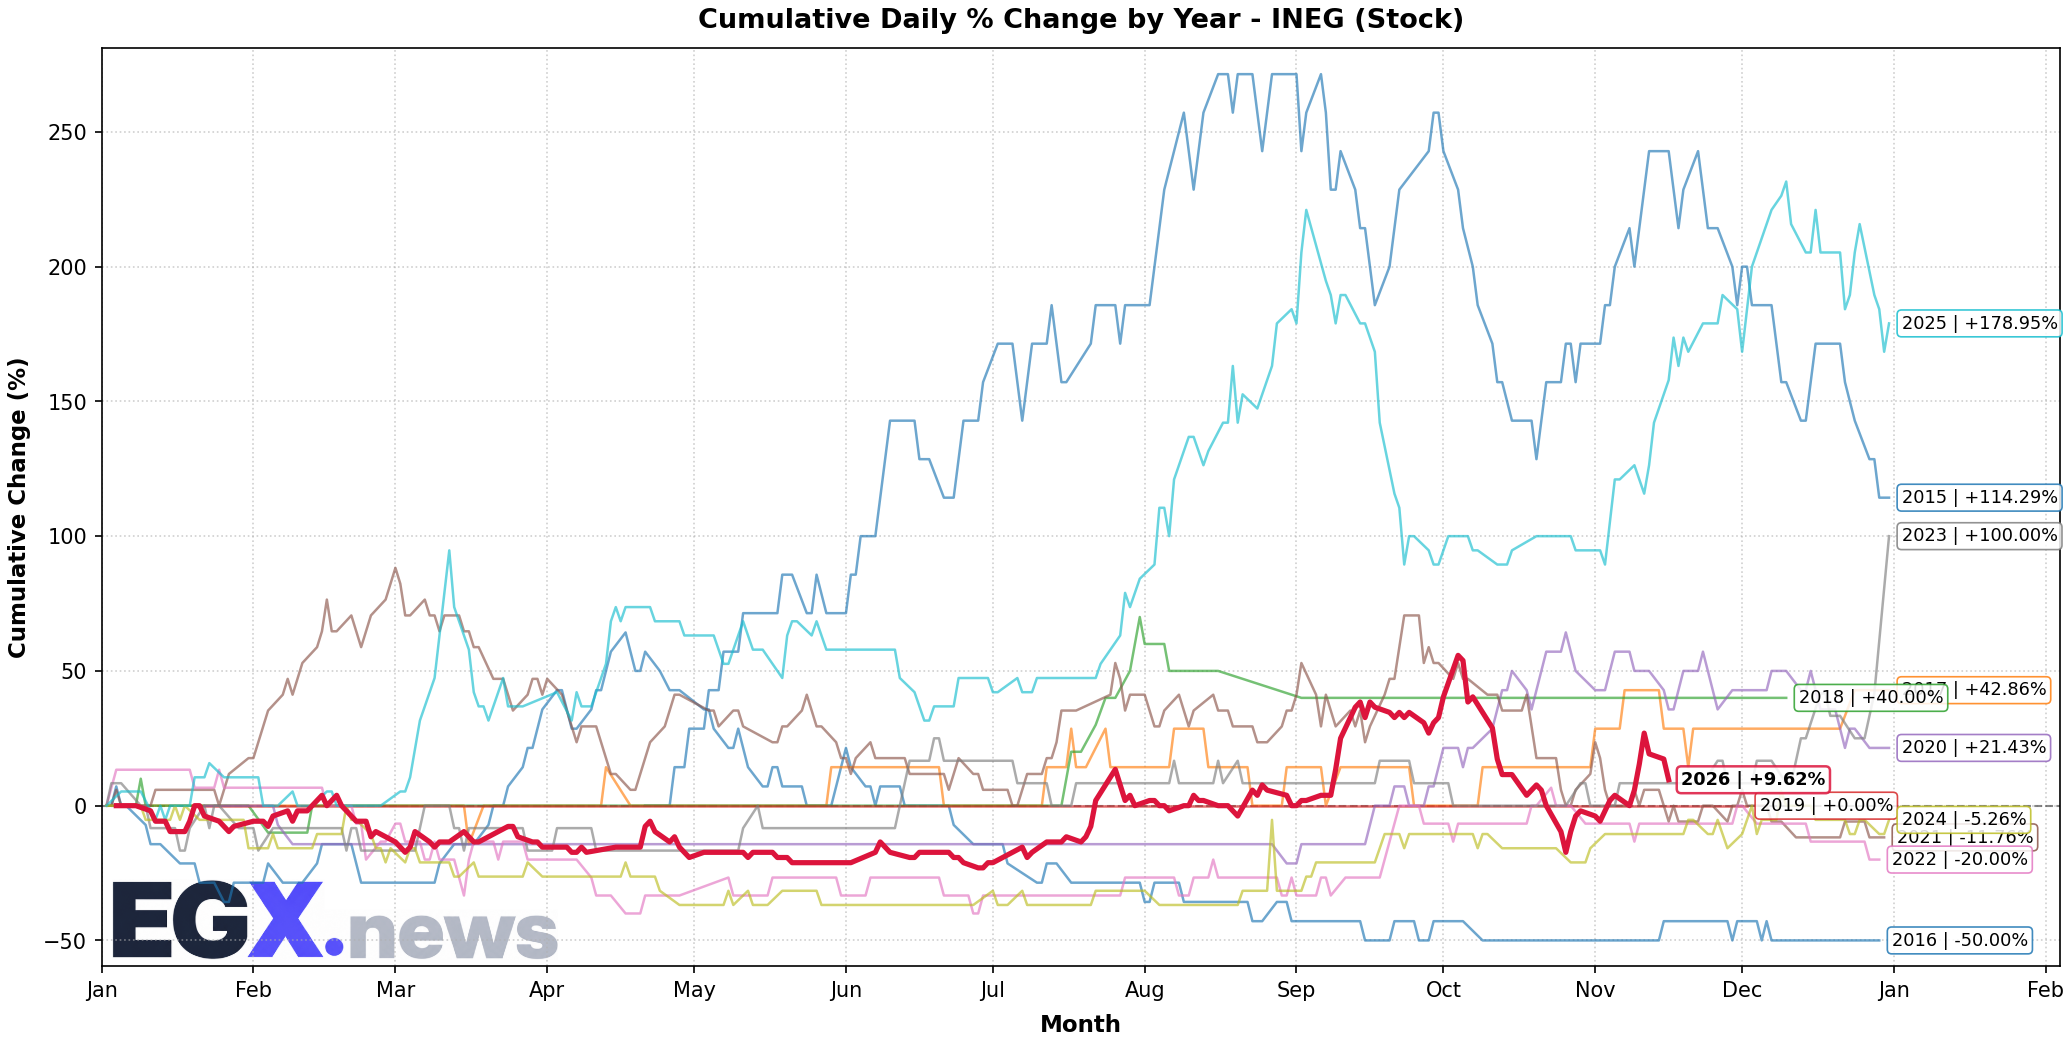
Click to EnlargeHistorical monthly seasonal return distribution and performance cycles for INEG.
Trend Structure & Moving Averages
Golden Cross (62D)Trend Score is 65/100 with price trading 5.56% above its 20-day SMA and above the 200-day long-term benchmark (SMA50 is above SMA200 for 62 sessions).
Momentum, Volume Flow & Volatility
RSI(14) is 49.84 (Neutral), moving +0.45 over the past 5 sessions — indicating a balanced / consolidation posture. MACD line (0.002) is above signal line (-0.013) with a histogram of +0.014 (Bullish Momentum).
20-day annualized volatility is 95.34%, ATR(14) is 0.04 (7.02% of price), and price is trading in the middle channel (%B: 0.652, Bandwidth: 42.59%).
Statistical Backtests & Historical Win Rates
BacktestedEmpirical backtesting reveals that RSI oversold dips (<30) historically yield an average 20-day return of +1.10% with a 39.22% win rate (51 observations, Reliability: Good), while volume spikes yield an average 20-day return of +3.94% (42.07% win rate).
Price sits 31.33% below All-Time High (0.83 set 29 sessions ago on 2026-10-05) and 31.33% below its 52-week high (0.83 on 2026-10-05).