


International
ICFCInternational Co. for Fertilizers & Chemicals
Company Overview & Activities
الاتجار فى الأسمدة والمخصبات الزراعية والبذور والتقاوى الزراعية والمبيدات الحشرية والزراعية والحبوب والأعلاف والمواد الخام الخاصة بها والآلات والمعدات الزراعية بأنوعها والمواد الغذائية . والقطن الزهر والشعر والغزل والأرز الابيض والشعير ومشتقاتة وجميع الحاصلات الزراعية من حقلية وبستانية وخضروات ، تأجير أراضى أو مخازن ومستودعات والمحالج والمضارب والمطاحن لاستعمالها فى أغراض الشركة ، أعمال الشحن والتفريغ بالموانئ ، الإتجار في التقاوى الزراعية والأعلاف والمواد الخام الخاصة بهم ، تصدير وتسويق والاتجار فى المحاصيل الزراعية ومستلزمات الإنتاج الزراعى ، استئجار المساحات والسعات التخزينية اللازمة لنشاط الشركة ، تأجير المساحات والسعات التخزينية الفائضة عن حاجة الشركة للغير ، تجارة الاعلاف ومستلزماتها ، القيام بأعمال التصدير لكافة الأنشطة المذكورة ، تسويق منتجات الشركات الأخرى ، نشاط الإستيراد فى مجال الأسمدة الكيماوية بجميع أنواعها والمخصبات الزراعية والمبيدات ، مع مراعاه أحكام القوانين واللوائح والقرارات السارية وبشرط استصدار التراخيص اللازمة لممارسة هذه الأنشطة ويجوز للشركة أن ت
EGS520D1C015
2024-09-18
FRA Certified Auditor
Financial FAQ & Technical Outlook for International Co. for Fertilizers & Chemicals (ICFC)
Quantitative Technical Engine (ICFC)
International holds a Very Bullish technical posture (Overall Score: 92.5/100) with Trend Score 100/100, Momentum Score 100/100 (RSI 66.15 - Strong Bullish Momentum), and Volume Score 70/100 (accumulating, 0.53x 20D baseline).
Support & Resistance Confluence Matrix
AlgorithmicNearest support is at 27.49 [Strength: 45.0/100, Tier 3 (Intraday 1-min)] (0.76% below price with a 100.0% confirmed bounce rate across 1 tests, Reliability: Low). Nearest resistance is at 27.97 [Strength: 45.0/100, Tier 3 (Intraday 1-min)] (0.97% above price with a 100.0% confirmed rejection rate across 1 tests, Reliability: Low).
Seasonal Trend & Historical Patterns (ICFC)
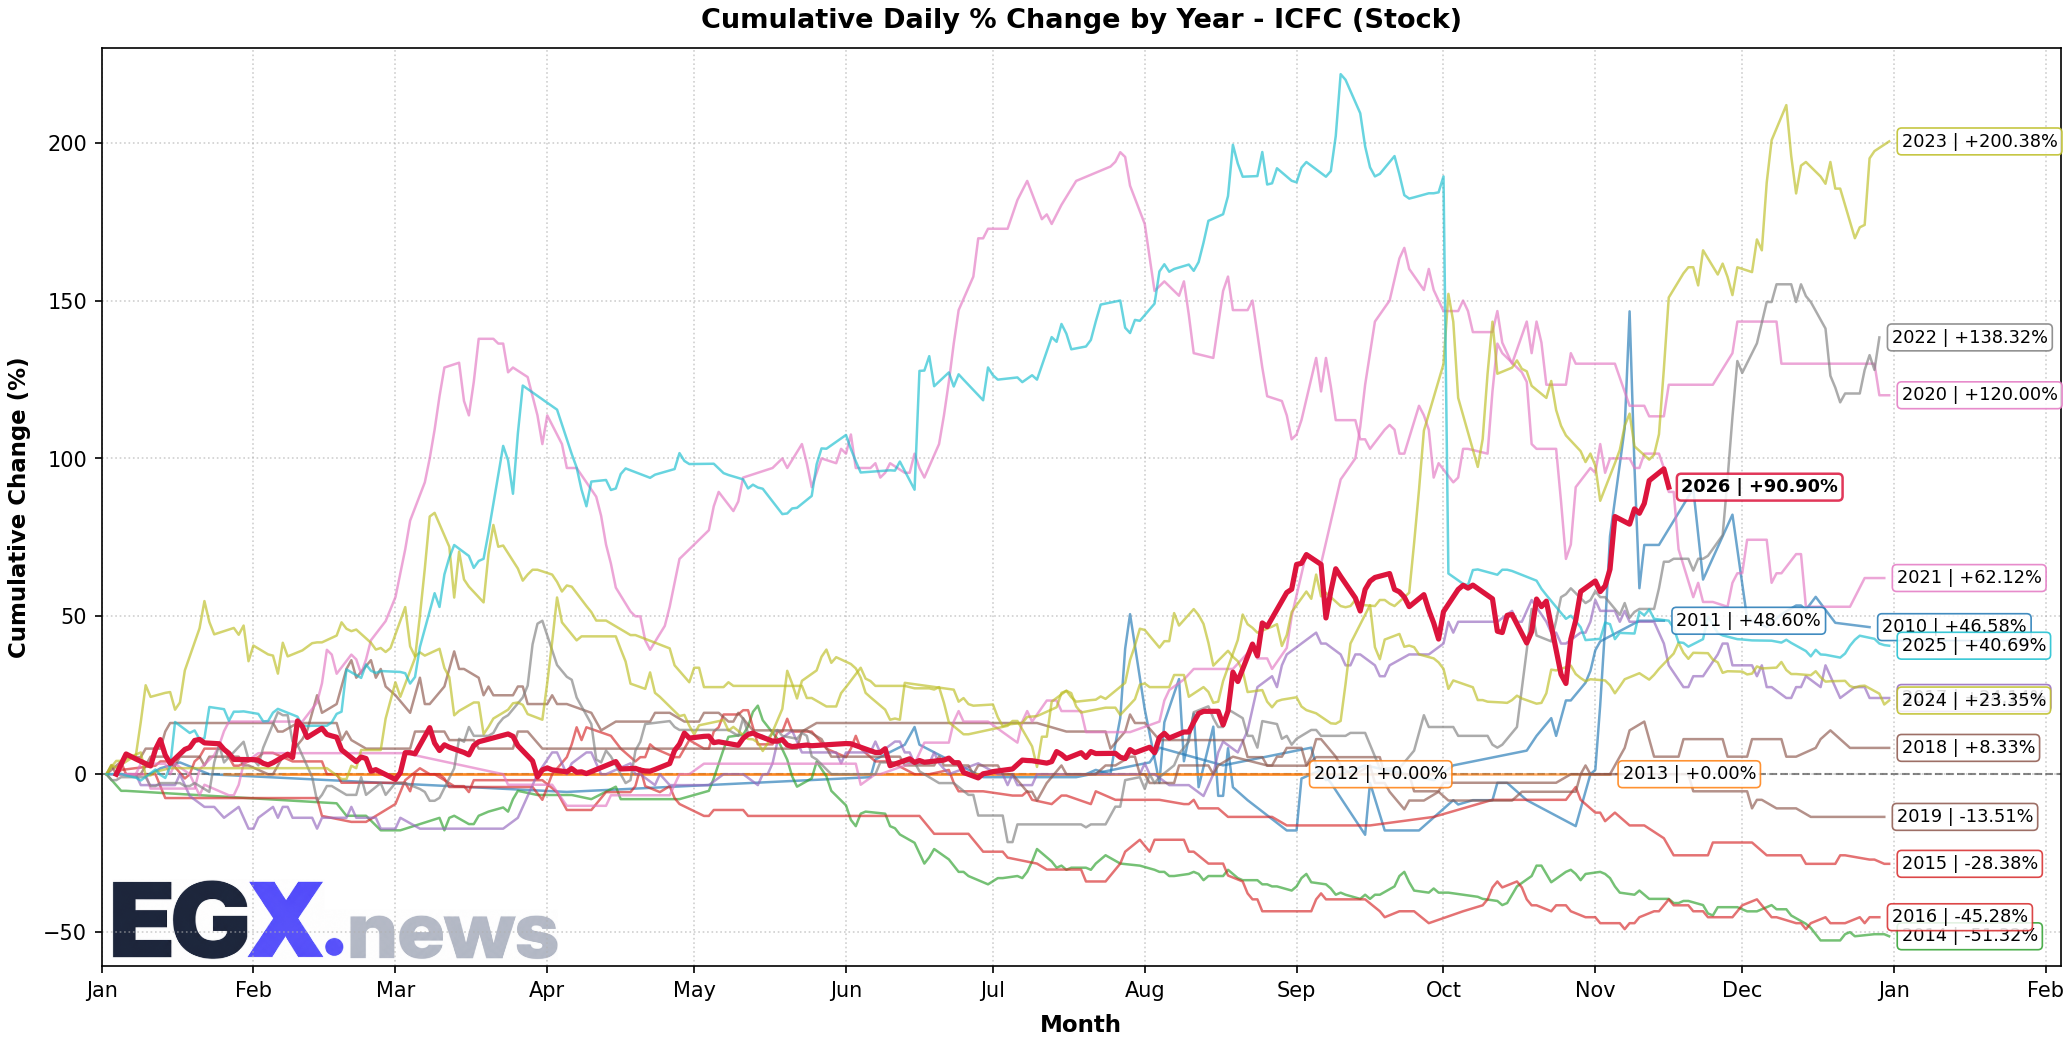
Click to EnlargeHistorical monthly seasonal return distribution and performance cycles for ICFC.
Trend Structure & Moving Averages
Golden Cross (63D)Trend Score is 100/100 with price trading 15.32% above its 20-day SMA and above the 200-day long-term benchmark (SMA50 is above SMA200 for 63 sessions).
Momentum, Volume Flow & Volatility
RSI(14) is 66.15 (Strong Bullish Momentum), moving -0.67 over the past 5 sessions — confirming powerful bullish upward pressure. MACD line (1.621) is above signal line (1.119) with a histogram of +0.502 (Bullish Momentum).
20-day annualized volatility is 87.19%, ATR(14) is 1.52 (5.49% of price), and price is trading near the upper band (%B: 0.815, Bandwidth: 48.67%).
Statistical Backtests & Historical Win Rates
BacktestedEmpirical backtesting reveals that RSI oversold dips (<30) historically yield an average 20-day return of +4.16% with a 50.68% win rate (73 observations, Reliability: Good), while volume spikes yield an average 20-day return of +6.03% (45.0% win rate).
Price sits 16.57% below All-Time High (33.2 set 275 sessions ago on 2025-09-11) and 4.15% below its 52-week high (28.9 on 2026-11-16).