


Ismailia Development & Real Estate
IDREIsmailia Development & Real Estate Co.
Company Overview & Activities
1-.تخطيط وإقامة المناطق العمرانية وتجهيزها بجميع المرافق والخدمات. 2.القيام بأعمال البنية الأساسية من مياه الشرب وصرف صحى وكهرباء وطرق وإتصالات والجراجات المتعددةالطوابق وعدادات تنظيم إنتظار السيارات. 3.الإسكان الذى تؤجر وحداته بالكامل خالية لأغراض السكن غير الإدارى بشرط الا يقل عدد الوحدات عن خمسين. 4.النقل الجماعى. 5.إقامة المستشفيات المتخصصة أو المتكاملة أو العامة وما تضمنه من أنشطة داخلية علاجية أو طبية ويشترط لتمتع هذه المستشفيات والمراكز بضمانات وحوافز أن تقدم 10% بالمجان سنوياً من عدد الأسرة التى يتم شغلها بالنسبة للمستشفى ومن الحالات التى يتم تقديم الخدمة الطبية أو العلاجية لها بالنسبة للمركز وذلك خلال مدة الإعفاء الضريبى. 6.النقل المبرد للبضائع و الثلاجات الخاصة بحفظ الحاصلات الزراعية و المنتجات الصناعية و المواد الغذائية و محطات الحاويات و صوامع الغلال و يشمل ذلك :- •النقل المبرد او المجمد للبضائع و الثلاجات و المحطات الخاصة بحفظ الحاصلات الزراعية و المنتجات الصناعية و المواد الغذائية و تبريدها او تجميدها . •محطات تشغيل و تداول الحاويات . •صوامع حفظ و تخزين الغلال
EGS214Q1C011
2011-06-16
FRA Certified Auditor
Financial FAQ & Technical Outlook for Ismailia Development & Real Estate Co. (IDRE)
Quantitative Technical Engine (IDRE)
Ismailia Development & Real Estate holds a Bullish technical posture (Overall Score: 63.0/100) with Trend Score 50/100, Momentum Score 90/100 (RSI 53.8 - Bullish Momentum), and Volume Score 70/100 (accumulating, 0.75x 20D baseline).
Support & Resistance Confluence Matrix
AlgorithmicNearest support is at 42.97 [Strength: 45.0/100, Tier 3 (Intraday 1-min)] (1.56% below price with a 100.0% confirmed bounce rate across 1 tests, Reliability: Low). Nearest resistance is at 43.8 [Strength: 61.4/100, Tier 3 (Intraday 1-min)] (0.34% above price with a 85.7% confirmed rejection rate across 35 tests, Reliability: High).
Seasonal Trend & Historical Patterns (IDRE)
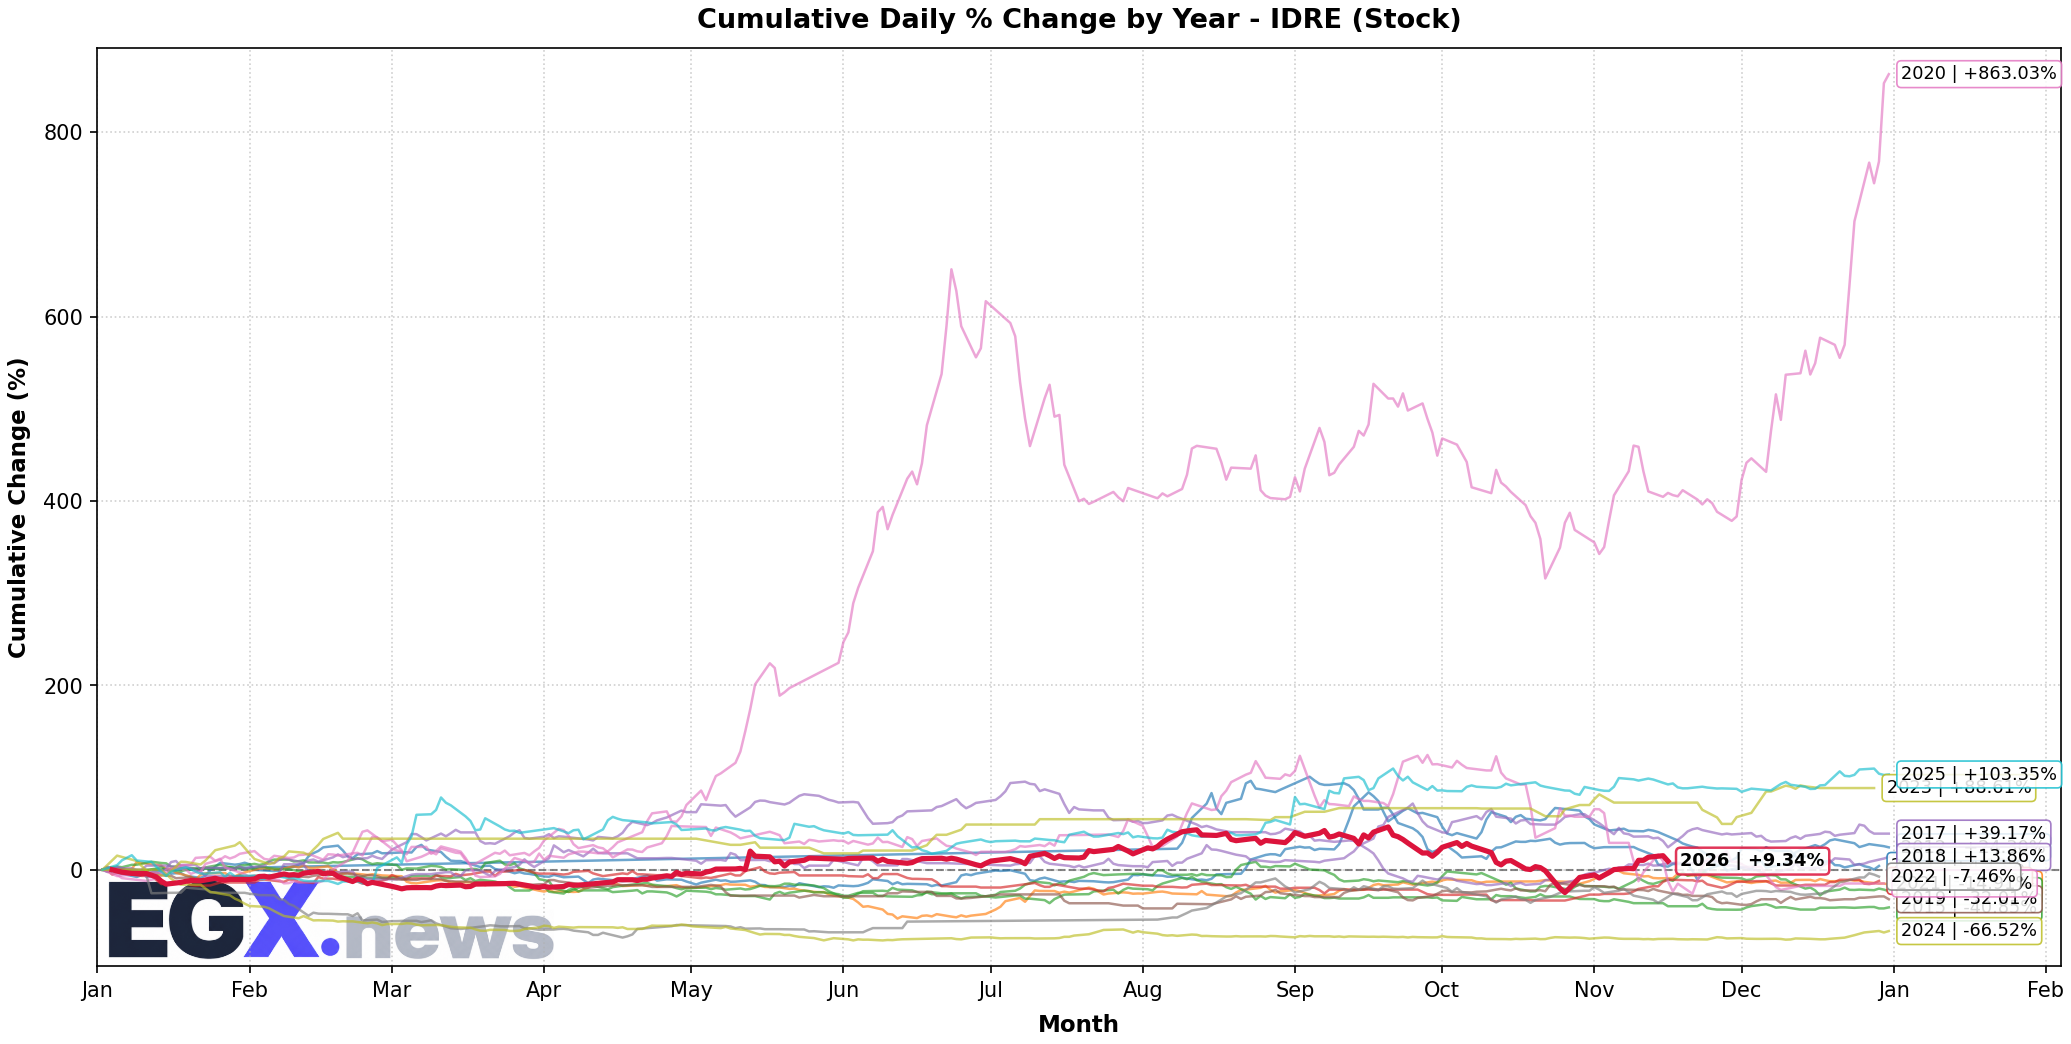
Click to EnlargeHistorical monthly seasonal return distribution and performance cycles for IDRE.
Trend Structure & Moving Averages
Golden Cross (118D)Trend Score is 50/100 with price trading 11.87% above its 20-day SMA and above the 200-day long-term benchmark (SMA50 is above SMA200 for 118 sessions).
Momentum, Volume Flow & Volatility
RSI(14) is 53.8 (Bullish Momentum), moving +5.17 over the past 5 sessions — indicating positive momentum in buyer territory. MACD line (0.042) is above signal line (-1.326) with a histogram of +1.368 (Bullish Momentum).
20-day annualized volatility is 98.39%, ATR(14) is 3.03 (6.94% of price), and price is trading in the middle channel (%B: 0.754, Bandwidth: 46.64%).
Statistical Backtests & Historical Win Rates
BacktestedEmpirical backtesting reveals that RSI oversold dips (<30) historically yield an average 20-day return of -1.28% with a 49.4% win rate (83 observations, Reliability: Good), while volume spikes yield an average 20-day return of +5.25% (55.35% win rate).
Price sits 55.49% below All-Time High (98.06 set 1183 sessions ago on 2021-09-05) and 26.88% below its 52-week high (59.7 on 2026-09-20).