


Ismailia Misr Poultry
ISMAIsmailia Misr Poultry
Company Overview & Activities
المشاركة في تنمية الثروة الداجنة وذلك عن طريق تربية جدود الدواجن وتربية أمهات دجاج اللحم وأمهات بيض المائدة وإنتاج وتفريخ بيض التفريخ وإنتاج بيض المائدة وكذا كتاكيت التسمين عمر يوم وإنتاج كتاكيت البيض وتربية دجاج اللحم ( التسمين ) وتصنيع الأعلاف على اختلاف أنواعها خاصة أعلاف الدواجن والأسماك وإنشاء وإدارة المجازر الألية للدواجن وإلحاق وحدات معالجة المياه ومعالجة المخلفات بها . ( الكوكر ) وتسويق منتجاته من البروتين الحيواني والزيوت وكذا إنتاج الدجاج المجمد والمبرد كاملا ومجزئاته ومصنعاته وبيع وتسويق كل ما يتعلق بالدواجن ومنتجاتها وتسويقها محليا وتصديرها للخارج وتشمل كافه البنود السابقة وكذلك بيع السماد البلدي وناتج مزارع تربيه الدواجن وتسويقه محليا . و يجوز للشركة ان تكون لها مصلحه او تشترك باى وجه من الوجوه مع الهيئات التى تزاول اعمالا شبية باعمالها او التى قد تعاونها على تحقيق غرضها فى مصر او فى الخارج كما يجوز لها ان تندمج فى الهيئات السالفة او تشتريها او تلحقها بها و ذلك طبقا لاحكام القانون و لائحته التنفيذية .
EGS02021C011
1995-06-07
FRA Certified Auditor
Financial FAQ & Technical Outlook for Ismailia Misr Poultry (ISMA)
Quantitative Technical Engine (ISMA)
Ismailia Misr Poultry holds a Neutral technical posture (Overall Score: 56.5/100) with Trend Score 40/100, Momentum Score 80/100 (RSI 48.68 - Neutral), and Volume Score 70/100 (accumulating, 0.94x 20D baseline).
Support & Resistance Confluence Matrix
AlgorithmicNearest support is at 21.2 [Strength: 45.0/100, Tier 3 (Intraday 1-min)] (1.12% below price with a 100.0% confirmed bounce rate across 1 tests, Reliability: Low). Nearest resistance is at 21.66 [Strength: 45.0/100, Tier 3 (Intraday 1-min)] (1.03% above price with a 100.0% confirmed rejection rate across 1 tests, Reliability: Low).
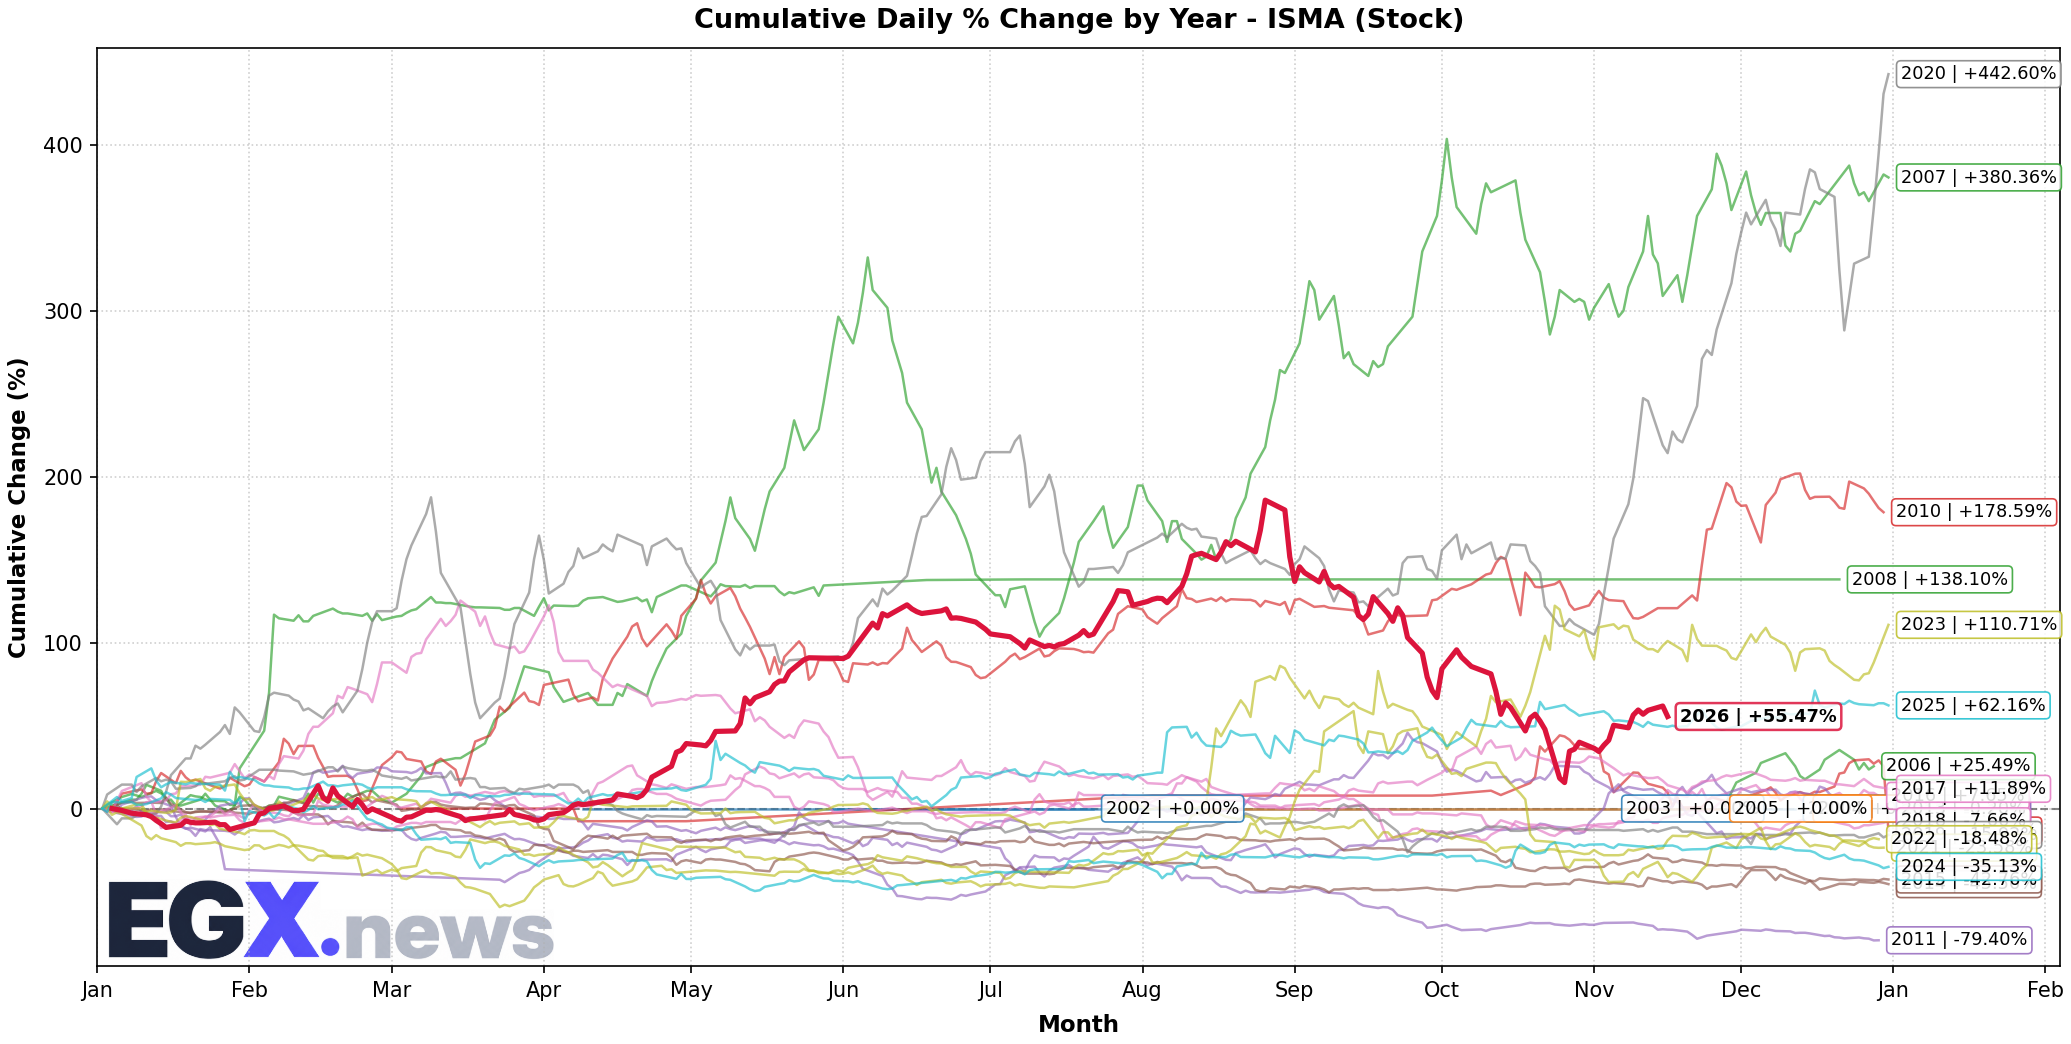
Seasonal Trend & Historical Patterns (ISMA)
Click to EnlargeHistorical monthly seasonal return distribution and performance cycles for ISMA.
Trend Structure & Moving Averages
Golden Cross (471D)Trend Score is 40/100 with price trading 7.25% above its 20-day SMA and below the 200-day long-term benchmark (SMA50 is above SMA200 for 471 sessions).
Momentum, Volume Flow & Volatility
RSI(14) is 48.68 (Neutral), moving -0.97 over the past 5 sessions — indicating a balanced / consolidation posture. MACD line (-0.546) is above signal line (-1.189) with a histogram of +0.642 (Bullish Momentum).
20-day annualized volatility is 103.86%, ATR(14) is 1.61 (7.51% of price), and price is trading in the middle channel (%B: 0.698, Bandwidth: 36.72%).
Statistical Backtests & Historical Win Rates
BacktestedEmpirical backtesting reveals that RSI oversold dips (<30) historically yield an average 20-day return of +4.47% with a 56.44% win rate (101 observations, Reliability: High), while volume spikes yield an average 20-day return of +7.92% (54.94% win rate).
Price sits 47.05% below All-Time High (40.49 set 55 sessions ago on 2026-08-30) and 47.05% below its 52-week high (40.49 on 2026-08-30).