


Ismailia National Food Industries
INFIIsmailia National Food Industries
Company Overview & Activities
1-استصلاح و استزراع الاراضى الصحراوية بكافة انواع الخضر و الفاكهة و المحاصيل الزراعية بوسائل التكنولوجيا الحديثة لطرق الرى . 2-تصنيع منتجات الطماطم و الفاكهة بانواعها المختلفة من مركزات و عجائن و عصائر و مشروبات و مربات و خلافه طبقا لاحدث الوسائل التكنولوجية الحديثة . 3-تصنيع و حفظ و تجميد و تعليب و تجفيف الخضراوات و الفواكه و البقول و غيرها . 4-تسويق منتجات الشركة داخل الجمهورية و التصدير خارج الجمهورية ( بالوسائل المختلفة للبيع سواء مباشرة او مندوبين او وكلاء و خلافه ) . 5-تصنيع و انتاج و تجهيز و تعبئة و تبريد و تعقيم و تجفيف و تخزين العصائر الطبيعيه و المركزات و النكتار و صلصة الطماطم و الخضروات و ذلك للشركة و للغير محليا و التصدير. 6-الاتجار فى المواد الغذائية الخام او النصف مصنعه التى تدخل ضمن نشاط الشركة سواء كانت محلية او مستورده و مواد التعبئة و التغليف المحلية و المستورده و استيراد و تصدير ما سبق و اعمال الوكالة التجارية . 7-انتاج و تعبئة و تغليف و تسويق المنتجات الغذائية المختلفه مثل منتجات الخل الطبيعى الغذائى و المخللات و البطاطس و المواد الغذائية الخام و النصف مصنعه
EGS01041C010
2010-09-06
FRA Certified Auditor
Financial FAQ & Technical Outlook for Ismailia National Food Industries (INFI)
Quantitative Technical Engine (INFI)
Ismailia National Food Industries holds a Bullish technical posture (Overall Score: 71.2/100) with Trend Score 65/100, Momentum Score 100/100 (RSI 65.09 - Strong Bullish Momentum), and Volume Score 70/100 (accumulating, 1.46x 20D baseline).
Support & Resistance Confluence Matrix
AlgorithmicNearest support is at 145.68 [Strength: 45.0/100, Tier 3 (Intraday 1-min)] (1.1% below price with a 100.0% confirmed bounce rate across 1 tests, Reliability: Low). Nearest resistance is at 148.92 [Strength: 45.0/100, Tier 3 (Intraday 1-min)] (1.1% above price with a 100.0% confirmed rejection rate across 1 tests, Reliability: Low).
Seasonal Trend & Historical Patterns (INFI)
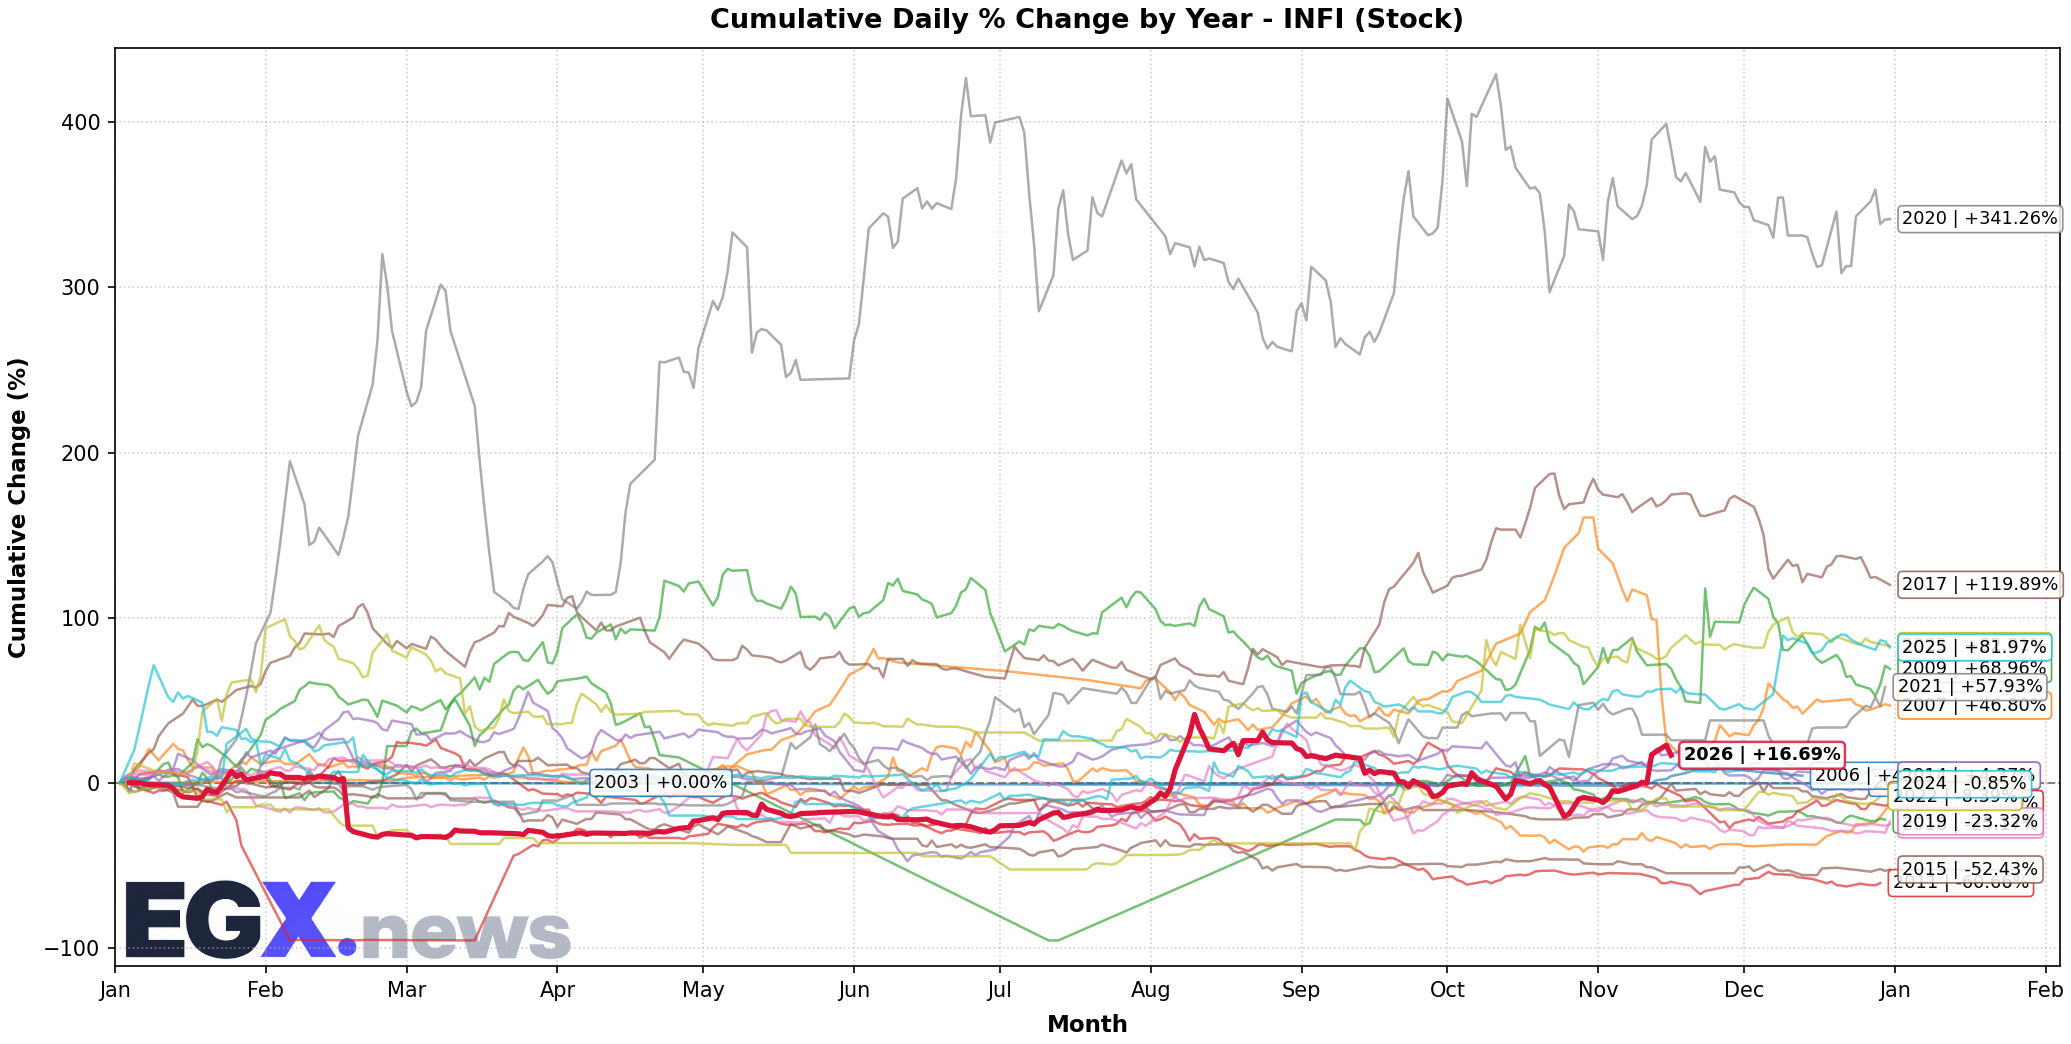
Click to EnlargeHistorical monthly seasonal return distribution and performance cycles for INFI.
Trend Structure & Moving Averages
Golden Cross (66D)Trend Score is 65/100 with price trading 20.54% above its 20-day SMA and above the 200-day long-term benchmark (SMA50 is above SMA200 for 66 sessions).
Momentum, Volume Flow & Volatility
RSI(14) is 65.09 (Strong Bullish Momentum), moving +11.32 over the past 5 sessions — confirming powerful bullish upward pressure. MACD line (5.222) is above signal line (0.675) with a histogram of +4.547 (Bullish Momentum).
20-day annualized volatility is 102.91%, ATR(14) is 10.15 (6.89% of price), and price is trading near the upper band (%B: 0.938, Bandwidth: 46.91%).
Statistical Backtests & Historical Win Rates
BacktestedEmpirical backtesting reveals that RSI oversold dips (<30) historically yield an average 20-day return of +44.01% with a 58.06% win rate (93 observations, Reliability: Good), while volume spikes yield an average 20-day return of +22.63% (52.31% win rate).
Price sits 23.28% below All-Time High (192.0 set 68 sessions ago on 2026-08-10) and 23.28% below its 52-week high (192.0 on 2026-08-10).