


KORRA
KORAKORRA
Company Overview & Activities
تعمل قرة في مجالي الطاقة والتشييد تحت اسم "قرة إنرجي"، وفي مجال التصدير الزراعي تحت العلامة التجارية "قرة أجري". تُعد شركة قرة إنرجي إحدى الشركات المصرية الرائدة، تمتد خبرتها لأكثر من 25 عامًا، ومتخصصة في حلول رفع كفاءة الطاقة وخدمات التشييد والبناء وقد تركنا بصمتنا الجلية في مجالات الطاقة الخضراء المستدامة من خلال تقديم حلول مبتكرة تعززالكفاءة وتسهم في خفض الانبعاثات، كما نقدم خدمات متكاملة في مجالات التشييد والبناء وبالأخص المتخصصة في الأعمال الكهروميكانيكية، الى جانب توريد الأنظمة الطاقة لمجموعة متنوعة من المنتجات، وبالاخص أنظمة توليد الطاقة والتكييف المركزي (HVAC). كما لدينا خدمات ما بعد البيع وإدارة المباني. أما "قرة أجري"، فتُعد حالياً من أكبر مصدري الفراولة الطازجة والمجمدة في مصر. الشركة حاصلة على أكثر من 15 شهادة جودة عالمية، وتقوم بالتصدير لأكثر من 25 دولة.
EGS07911C018
2024-12-11
FRA Certified Auditor
Financial FAQ & Technical Outlook for KORRA (KORA)
Quantitative Technical Engine (KORA)
KORRA holds a Neutral technical posture (Overall Score: 44.8/100) with Trend Score 15/100, Momentum Score 70/100 (RSI 36.61 - Bearish Momentum), and Volume Score 70/100 (accumulating, 0.81x 20D baseline).
Support & Resistance Confluence Matrix
AlgorithmicNearest support is at 2.04 [Strength: 65.0/100, Tier 3 (Intraday 1-min)] (1.92% below price with a 100.0% confirmed bounce rate across 30 tests, Reliability: High). Nearest resistance is at 2.09 (Volume Profile POC Anchor) [Strength: 60.0/100, Tier 3 (Intraday 1-min)] (0.48% above price with a 100.0% confirmed rejection rate across 1 tests, Reliability: Low).
Seasonal Trend & Historical Patterns (KORA)
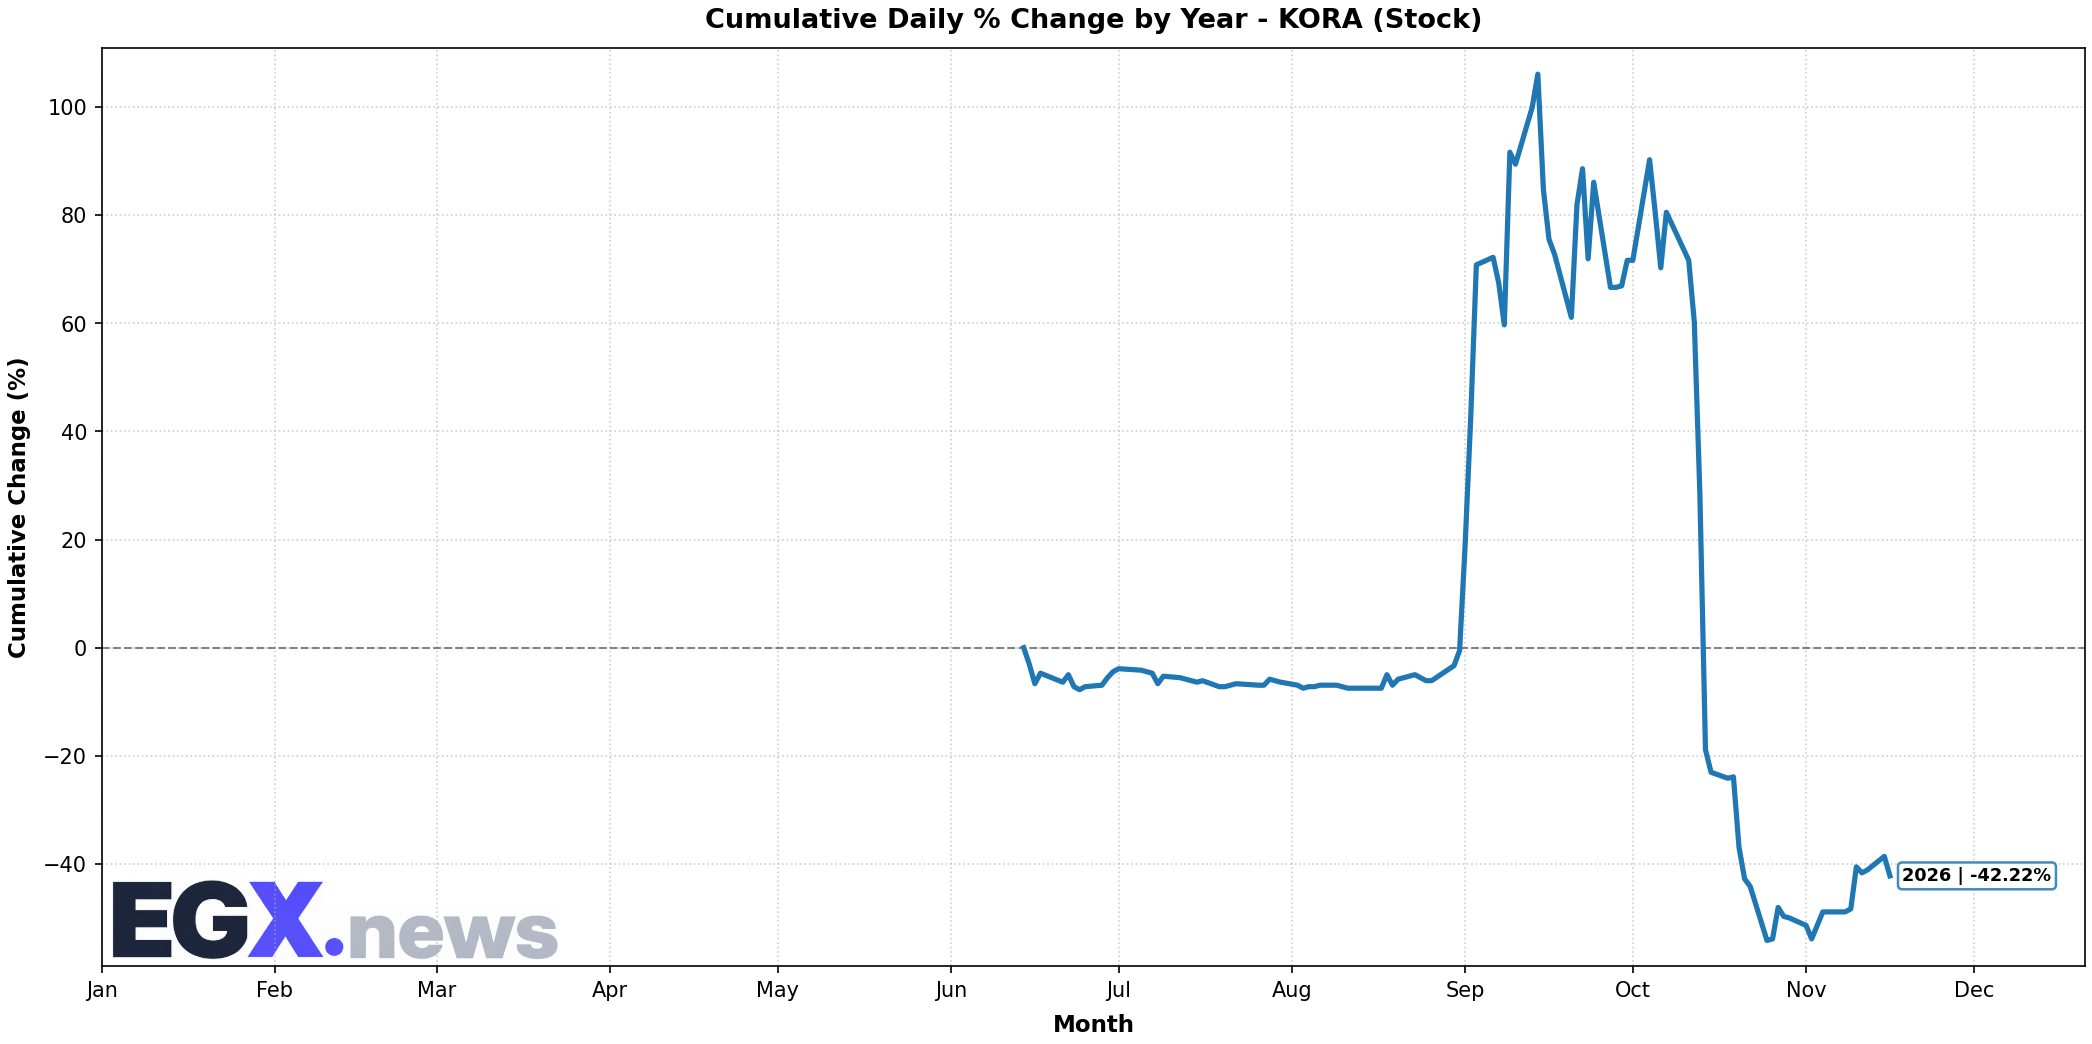
Click to EnlargeHistorical monthly seasonal return distribution and performance cycles for KORA.
Trend Structure & Moving Averages
Trend Score is 15/100 with price trading 8.33% above its 20-day SMA (SMA50 is below SMA200).
Momentum, Volume Flow & Volatility
RSI(14) is 36.61 (Bearish Momentum), moving +7.39 over the past 5 sessions — reflecting persistent selling pressure. MACD line (-0.529) is above signal line (-0.704) with a histogram of +0.175 (Bullish Momentum).
20-day annualized volatility is 127.74%, ATR(14) is 0.26 (12.5% of price), and price is trading in the middle channel (%B: 0.714, Bandwidth: 40.1%).
Statistical Backtests & Historical Win Rates
BacktestedEmpirical backtesting reveals that RSI oversold dips (<30) historically yield an average 20-day return of +17.50% with a 50.0% win rate (10 observations, Reliability: Low), while volume spikes yield an average 20-day return of +2.71% (33.33% win rate).
Price sits 73.57% below All-Time High (7.87 set 44 sessions ago on 2026-09-14) and 73.57% below its 52-week high (7.87 on 2026-09-14).