


Lotus
LUTSLotus For Agricultural Investments And Development
Company Overview & Activities
1.شراء وبيع وزراعة واستصلاح الأراضي بانواعها ( أكثر من الف فدان واقل من عشرين الف فدان ) وإقامة وتملك مشروعات الإنتاج الحيواني والداجني . 2.- إدارة المشروعات الزراعية ومشروعات الإنتاج الحيواني والداجني لصالح الشركة وللغير وتقديم الاستشارات الفنية (فيما عدا ما يتعلق باسواق الأوراق المالية وكذا الاستشارات القانونية والاستشارات والدراسات المتعلقة بالتقييم بمناسبة زيادة راس المال والاستحواذ وكذا الاستشارات المالية عن الأوراق المالية لانشطة الشركات العاملة في مجال الأوراق المالية المنصوص عليها في المادة (27) من قانون سوق راس المال ولائحته التنفيذية). 3. التجارة العامة والاستيراد والتصدير لكل ما هو مسموح به قانونا . 4.فرم وتعبئة وتغليف سيلاج الإدارة الخضراء لدى الغير . 5. تجارة وإنتاج التقاوي والحاصلات الزراعية بجميع أنواعها . 6.تاجير المعدات والالات الزراعية فيما عدا التاجير التمويلي . 7. تجارة الأسمدة والمبيدات الزراعية . 8.تصنيع وتعبئة وتغليف وتوزيع جميع المواد الغذائية. مع مراعاة ما ورد بقرار رئيس مجلس الوزراء رقم 350 لسنة 2017 وقرار السيد رئيس جمهورية رقم 356 لسنة 2008
EGS07661C019
2024-07-21
FRA Certified Auditor
Financial FAQ & Technical Outlook for Lotus For Agricultural Investments And Development (LUTS)
Quantitative Technical Engine (LUTS)
Lotus holds a Bullish technical posture (Overall Score: 63.0/100) with Trend Score 50/100, Momentum Score 90/100 (RSI 50.21 - Bullish Momentum), and Volume Score 70/100 (accumulating, 1.29x 20D baseline).
Support & Resistance Confluence Matrix
AlgorithmicNearest support is at 0.75 [Strength: 45.0/100, Tier 3 (Intraday 1-min)] (1.32% below price with a 100.0% confirmed bounce rate across 1 tests, Reliability: Low). Nearest resistance is at 0.77 [Strength: 82.9/100, Tier 1 (Macro 500D)] (1.32% above price with a 91.7% confirmed rejection rate across 24 tests, Reliability: High).
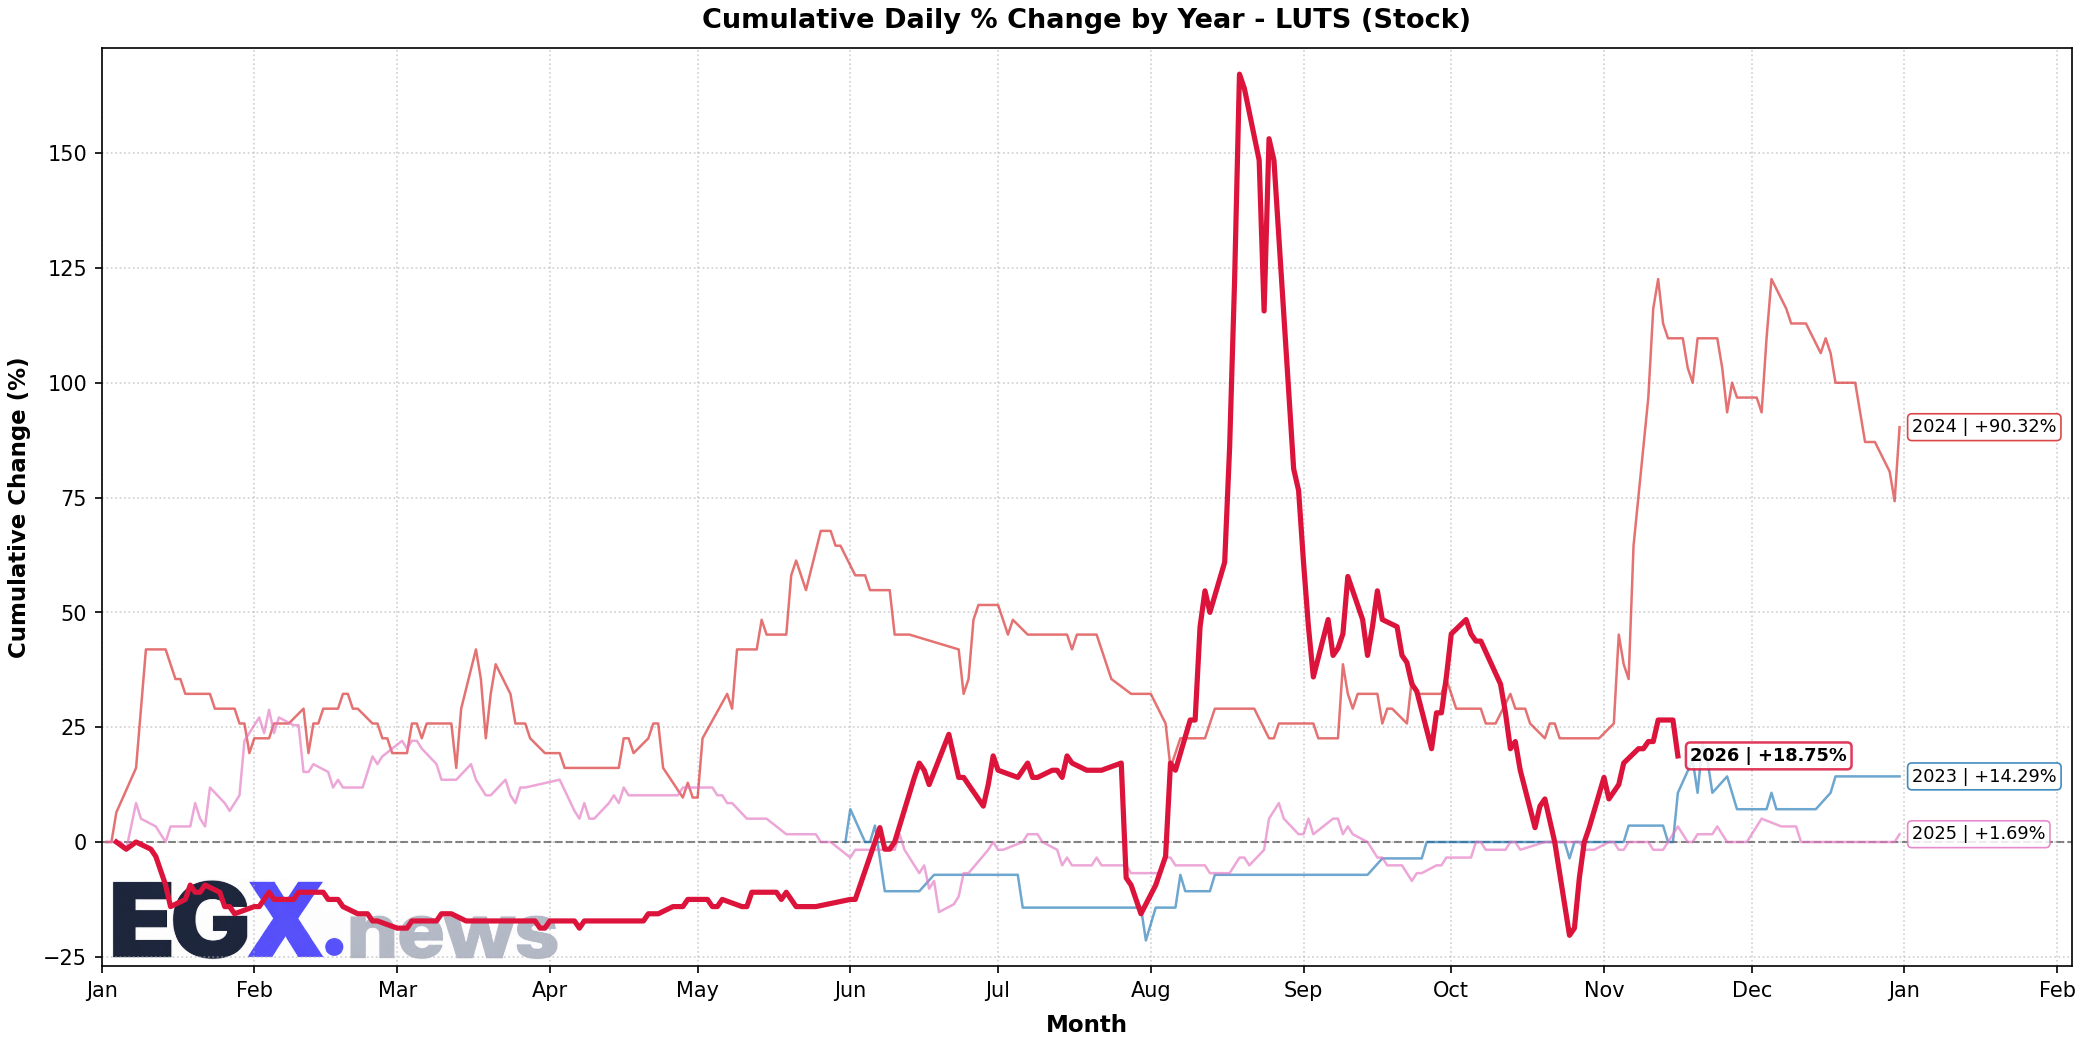
Seasonal Trend & Historical Patterns (LUTS)
Click to EnlargeHistorical monthly seasonal return distribution and performance cycles for LUTS.
Trend Structure & Moving Averages
Golden Cross (100D)Trend Score is 50/100 with price trading 8.57% above its 20-day SMA and above the 200-day long-term benchmark (SMA50 is above SMA200 for 100 sessions).
Momentum, Volume Flow & Volatility
RSI(14) is 50.21 (Bullish Momentum), moving -2.51 over the past 5 sessions — indicating positive momentum in buyer territory. MACD line (0.0) is above signal line (-0.02) with a histogram of +0.020 (Bullish Momentum).
20-day annualized volatility is 110.56%, ATR(14) is 0.07 (9.21% of price), and price is trading in the middle channel (%B: 0.657, Bandwidth: 50.0%).
Statistical Backtests & Historical Win Rates
BacktestedEmpirical backtesting reveals that RSI oversold dips (<30) historically yield an average 20-day return of +22.66% with a 62.5% win rate (8 observations, Reliability: Very Low), while volume spikes yield an average 20-day return of +4.81% (50.0% win rate).
Price sits 61.42% below All-Time High (1.97 set 60 sessions ago on 2026-08-20) and 61.42% below its 52-week high (1.97 on 2026-08-20).