


Madinet Masr for Housing & Development
MASRMadinet Masr for Housing & Development
Company Overview & Activities
مزاولة كافة الأنشطة المتعلقة بالتنمية العقارية للأراضي والمباني والمنشآت بما في ذلك الحصول على كافة الأراضي والعقارات وبيعها وتأجيرها وكذا القيام بأعمال تقسيم الأراضي وتزويدها بكافة أنواع المرافق اللازمة للتعمير والمتصلة به وذلك في منطقة مدينة نصر وغيرها من المناطق بمحافظات الجمهورية وشراء وإنشاء واستغلال وتأجير وبيع جميع المباني والأراضي، وللشركة أن تقوم بإنشاء وإدارة واستثمار جميع المنشآت السكنية والإدارية والسياحية والترفيهية المتصلة بهذه الأراضي.
EGS65571C019
1995-05-07
FRA Certified Auditor
Financial FAQ & Technical Outlook for Madinet Masr for Housing & Development (MASR)
Quantitative Technical Engine (MASR)
Madinet Masr for Housing & Development holds a Neutral technical posture (Overall Score: 47.8/100) with Trend Score 35/100, Momentum Score 80/100 (RSI 46.6 - Neutral), and Volume Score 35/100 (distributing, 0.61x 20D baseline).
Support & Resistance Confluence Matrix
AlgorithmicNearest support is at 6.71 [Strength: 85.0/100, Tier 1 (Macro 500D)] (1.18% below price with a 100.0% confirmed bounce rate across 13 tests, Reliability: High). Nearest resistance is at 6.82 [Strength: 45.0/100, Tier 3 (Intraday 1-min)] (0.44% above price with a 100.0% confirmed rejection rate across 1 tests, Reliability: Low).
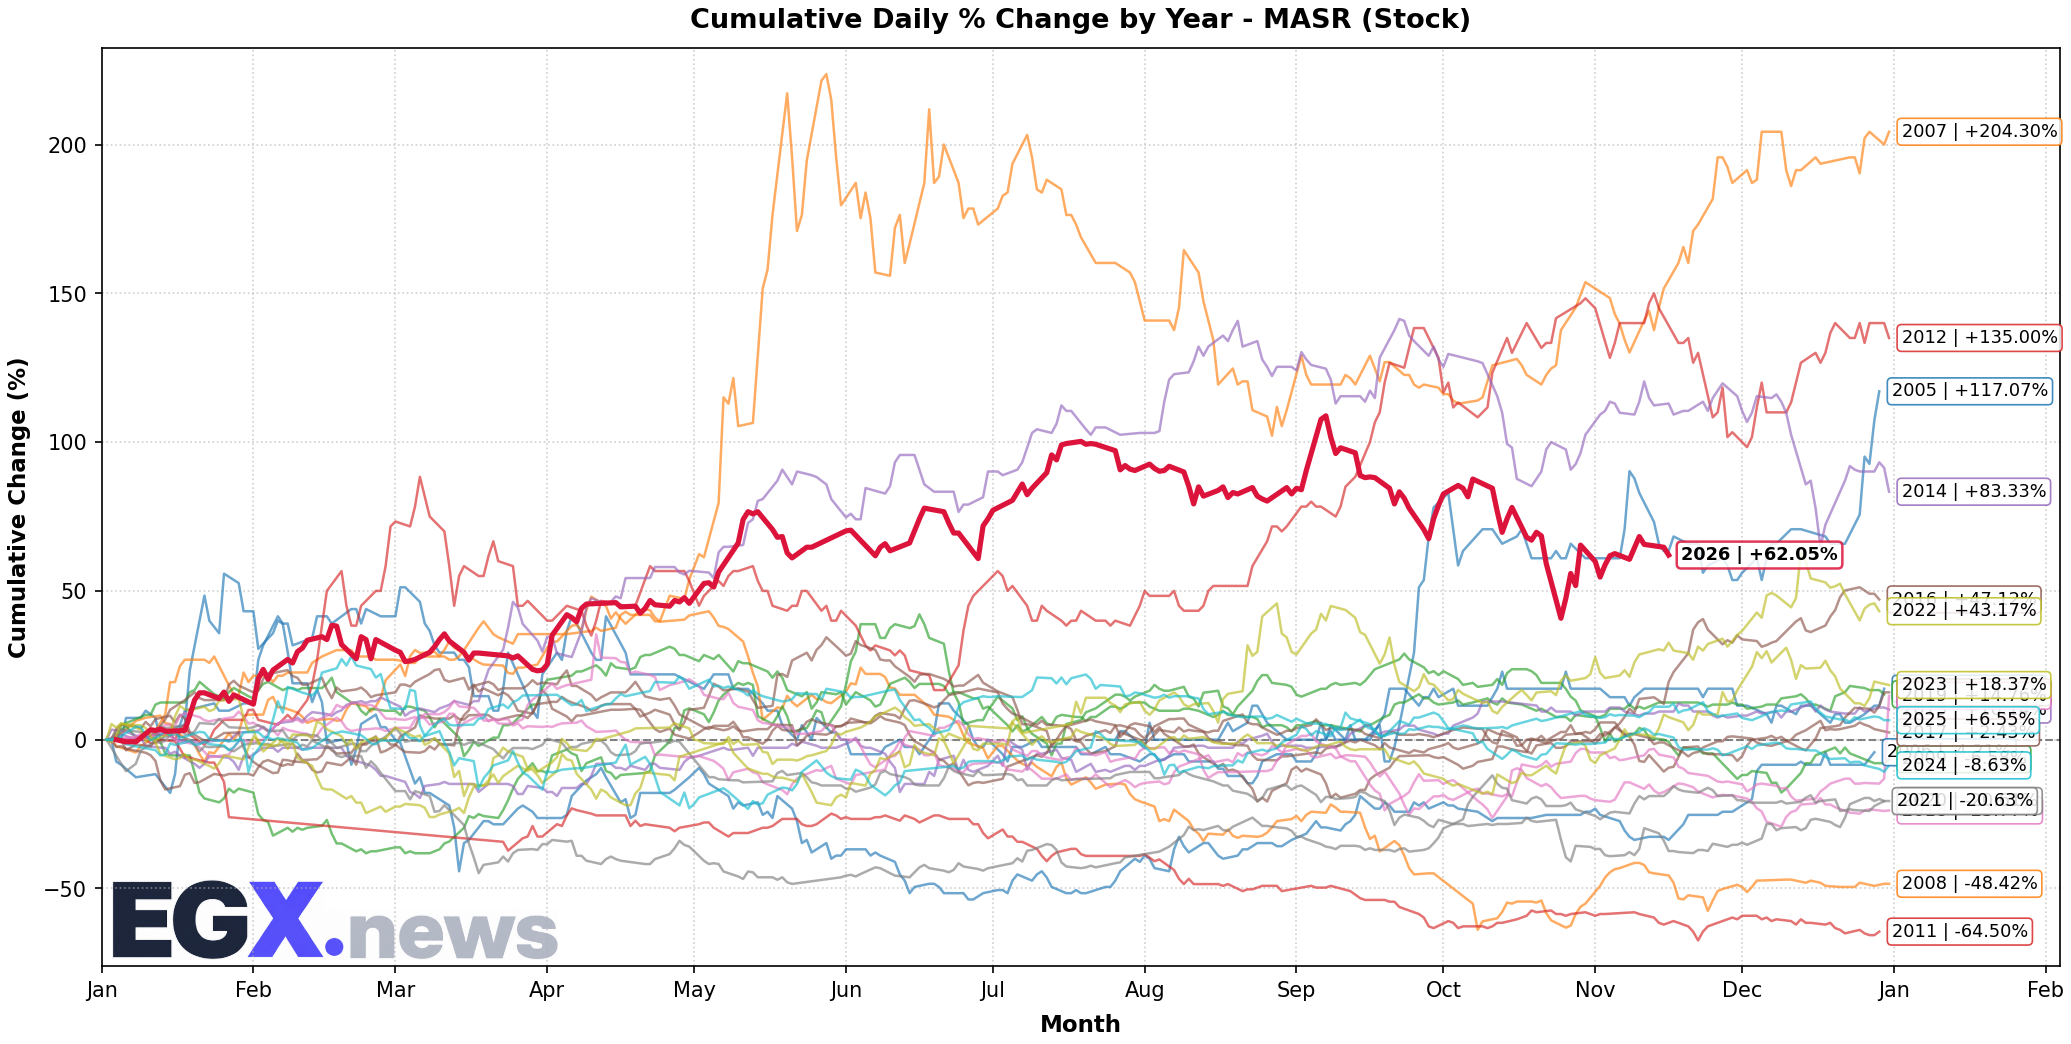
Seasonal Trend & Historical Patterns (MASR)
Click to EnlargeHistorical monthly seasonal return distribution and performance cycles for MASR.
Trend Structure & Moving Averages
Golden Cross (185D)Trend Score is 35/100 with price trading 1.04% above its 20-day SMA and above the 200-day long-term benchmark (SMA50 is above SMA200 for 185 sessions).
Momentum, Volume Flow & Volatility
RSI(14) is 46.6 (Neutral), moving -2.26 over the past 5 sessions — indicating a balanced / consolidation posture. MACD line (-0.091) is above signal line (-0.149) with a histogram of +0.059 (Bullish Momentum).
20-day annualized volatility is 68.97%, ATR(14) is 0.31 (4.57% of price), and price is trading in the middle channel (%B: 0.557, Bandwidth: 18.15%).
Statistical Backtests & Historical Win Rates
BacktestedEmpirical backtesting reveals that RSI oversold dips (<30) historically yield an average 20-day return of +1.28% with a 52.04% win rate (98 observations, Reliability: Good), while volume spikes yield an average 20-day return of +3.21% (53.12% win rate).
Price sits 24.13% below All-Time High (8.95 set 49 sessions ago on 2026-09-07) and 24.13% below its 52-week high (8.95 on 2026-09-07).