


Maridive & Oil Services
MOILMaridive & Oil Services SAE
Company Overview & Activities
غرض الشركة هو القيام في المناطق الحرة بجمهورية مصر العربية بكافة الأعمال البحرية من خدمات وصيانة وتركيبات وإنشاءات وإنتشال سواء تحت سطح الماء أو خارجه والأعمال المتعلقة بالخدمات الصناعية للمنشآت البحرية والارضية من نظافة وصيانة وإنشاءات وتركيبات ونقل وتموين وتزويد كافة المعدات اللازمة وقطع الغيار المتعلقة بها.
EGS44012C010
1992-04-07
FRA Certified Auditor
Financial FAQ & Technical Outlook for Maridive & Oil Services SAE (MOIL)
Quantitative Technical Engine (MOIL)
Maridive & Oil Services holds a Very Bullish technical posture (Overall Score: 87.0/100) with Trend Score 80/100, Momentum Score 100/100 (RSI 62.91 - Strong Bullish Momentum), and Volume Score 100/100 (accumulating, 1.5x 20D baseline).
Support & Resistance Confluence Matrix
AlgorithmicNearest support is at 0.69 [Strength: 45.0/100, Tier 3 (Intraday 1-min)] (1.43% below price with a 100.0% confirmed bounce rate across 1 tests, Reliability: Low). Nearest resistance is at 0.71 [Strength: 65.0/100, Tier 3 (Intraday 1-min)] (1.43% above price with a 100.0% confirmed rejection rate across 121 tests, Reliability: High).
Seasonal Trend & Historical Patterns (MOIL)
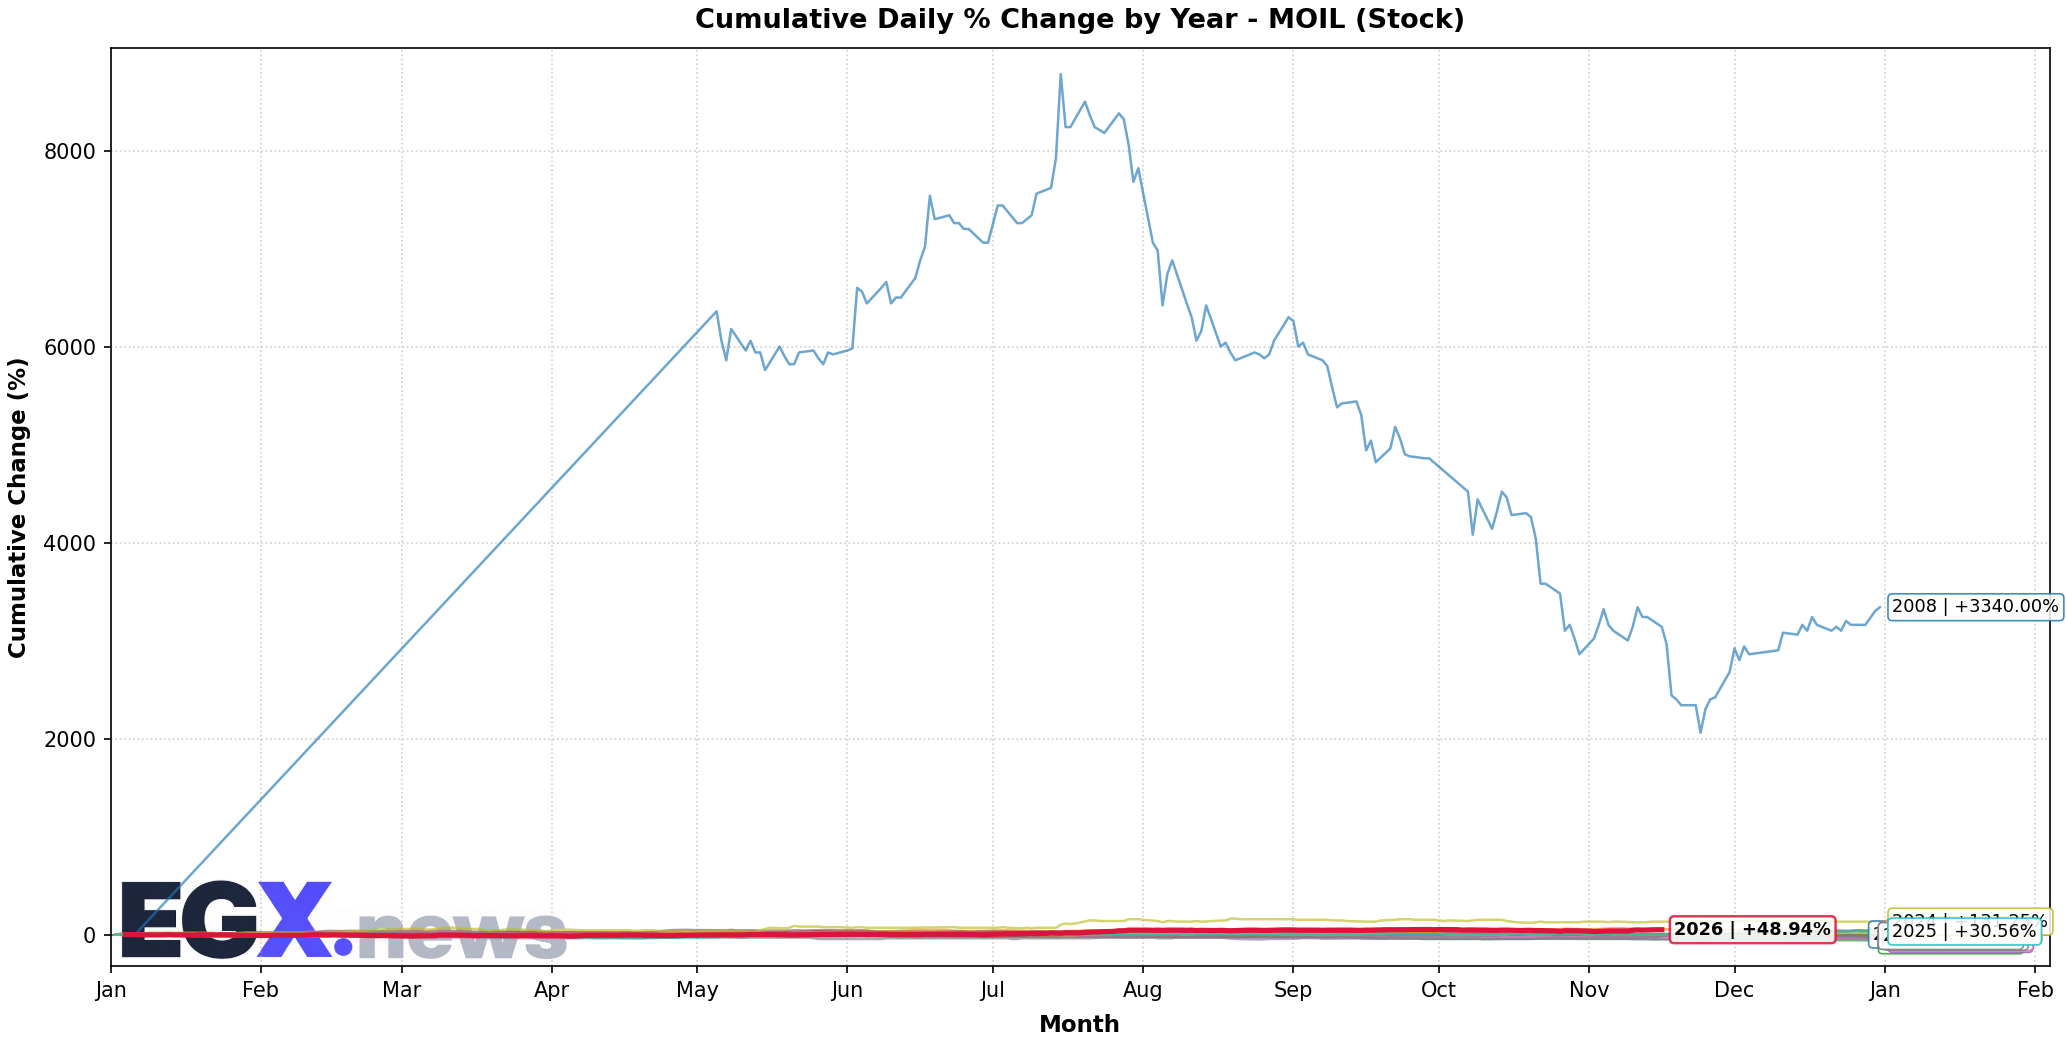
Click to EnlargeHistorical monthly seasonal return distribution and performance cycles for MOIL.
Trend Structure & Moving Averages
Golden Cross (302D)Trend Score is 80/100 with price trading 7.69% above its 20-day SMA and above the 200-day long-term benchmark (SMA50 is above SMA200 for 302 sessions).
Momentum, Volume Flow & Volatility
RSI(14) is 62.91 (Strong Bullish Momentum), moving +18.38 over the past 5 sessions — confirming powerful bullish upward pressure. MACD line (0.005) is above signal line (-0.004) with a histogram of +0.009 (Bullish Momentum).
20-day annualized volatility is 38.6%, ATR(14) is 0.02 (2.86% of price), and price is trading near the upper band (%B: 1.0, Bandwidth: 15.38%).
Statistical Backtests & Historical Win Rates
BacktestedEmpirical backtesting reveals that RSI oversold dips (<30) historically yield an average 20-day return of -1.50% with a 39.18% win rate (171 observations, Reliability: High), while volume spikes yield an average 20-day return of +0.57% (41.88% win rate).
Price sits 84.51% below All-Time High (4.52 set 4410 sessions ago on 2008-07-15) and 2.78% below its 52-week high (0.72 on 2026-09-24).