


Middle & West Delta Flour Mills
WCDFMiddle & West Delta Flour Mills Co.
Company Overview & Activities
تصنيع و تجارة و استيراد و تصدير و تخزين و تبخير و صيانة و تعبئة و نقل و توزيع الحبوب و منتجاتها و بدائلها -الخبز بانواعه -المكرونه -العجائن و المخبوزات – المواد الغذائية بصفه عامة – الاعلاف و مكوناتها – الخمائر – الثلج و التبريد و التجميد – مستلزمات التعبئة و التغليف – المعدات الراس مالية و قطع الغيار اللازمة او المتصلة بهذه الأغراض – مستلزمات التشغيل و الإنتاج – مخلفات التشغيل و الإنتاج – تقسيم الاراضى و البناء عليها لاستغلالها في الأنشطة الثقافية و الاجتماعية و الترفيهية و الاستثمار العقارى و اى أنشطة أخرى تحقق عوائد مناسبة لاستغلال الطاقة المتاحه و غير المستغله و التي منها اراضى الشون و المطاحن التي تم إيقاف تشغيلها ، و ذلك لحسابها او لحساب الغير في جمهورية مصر العربية او خارجها في ماعدا منطقة شبة جزيرة سيناء فيلزم موافقة الهيئة مسبقا و كذلك اعمال الوكالة التجارية عن الغير في جمهورية مصر العربية او خارجها في ما عدا منطقة شبة جزيرة سيناء فيلزم موافقة الهيئة مسبقا ، و يجوز للشركة إقامة و انشاء و إدارة المنشأت الفندقية و السياحية و انشاء و إدارة مولات تجارية ، كما يجوز ان تكون لها مصلح
EGS30421C019
1996-05-11
FRA Certified Auditor
Financial FAQ & Technical Outlook for Middle & West Delta Flour Mills Co. (WCDF)
Quantitative Technical Engine (WCDF)
Middle & West Delta Flour Mills holds a Neutral technical posture (Overall Score: 59.0/100) with Trend Score 40/100, Momentum Score 90/100 (RSI 53.44 - Bullish Momentum), and Volume Score 45/100 (accumulating, 1.97x 20D baseline).
Support & Resistance Confluence Matrix
AlgorithmicNearest support is at 545.81 [Strength: 45.0/100, Tier 3 (Intraday 1-min)] (0.76% below price with a 100.0% confirmed bounce rate across 1 tests, Reliability: Low). Nearest resistance is at 558.02 [Strength: 80.6/100, Tier 1 (Macro 500D)] (1.46% above price with a 82.4% confirmed rejection rate across 17 tests, Reliability: High).
Seasonal Trend & Historical Patterns (WCDF)
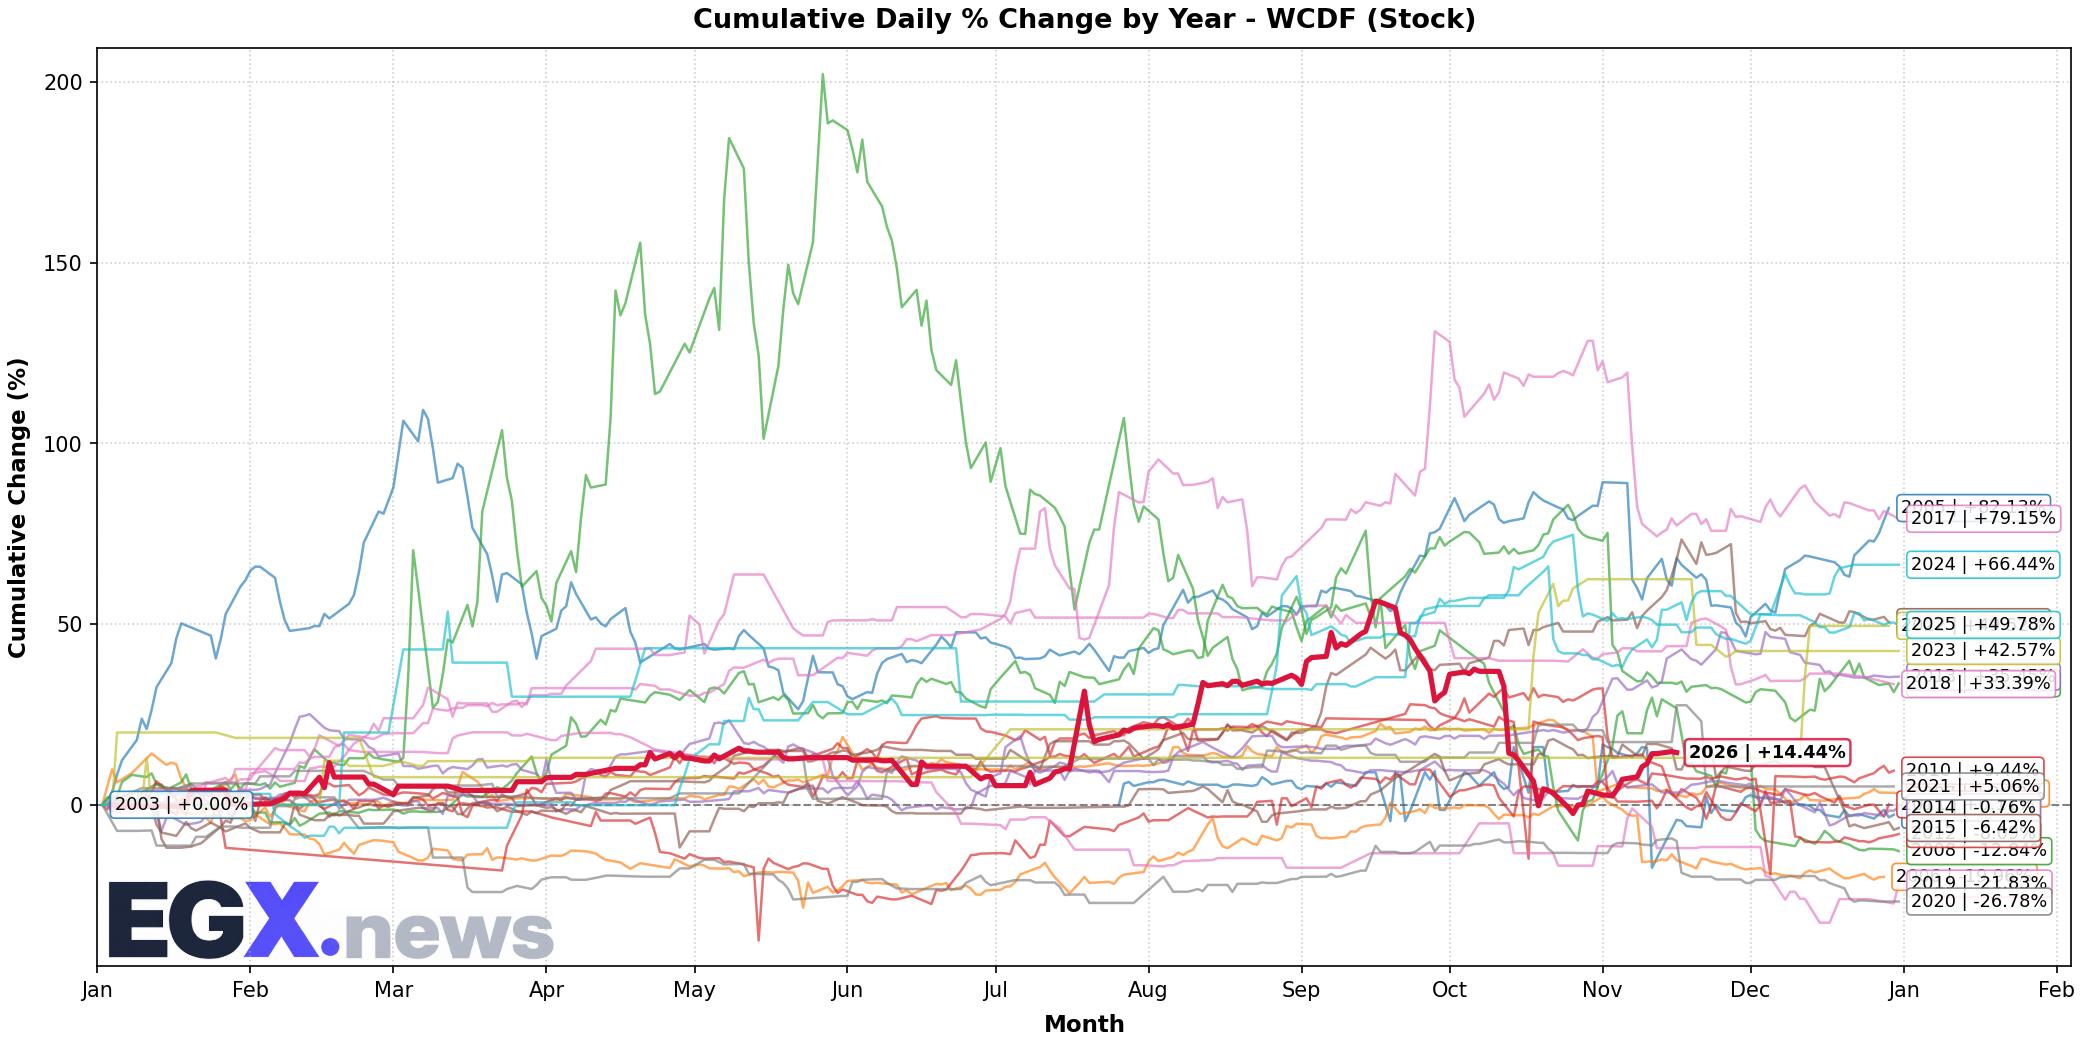
Click to EnlargeHistorical monthly seasonal return distribution and performance cycles for WCDF.
Trend Structure & Moving Averages
Golden Cross (1063D)Trend Score is 40/100 with price trading 8.03% above its 20-day SMA and below the 200-day long-term benchmark (SMA50 is above SMA200 for 1063 sessions).
Momentum, Volume Flow & Volatility
RSI(14) is 53.44 (Bullish Momentum), moving +6.28 over the past 5 sessions — indicating positive momentum in buyer territory. MACD line (-8.878) is above signal line (-21.084) with a histogram of +12.206 (Bullish Momentum).
20-day annualized volatility is 31.67%, ATR(14) is 25.17 (4.58% of price), and price is trading near the upper band (%B: 0.886, Bandwidth: 20.82%).
Statistical Backtests & Historical Win Rates
BacktestedEmpirical backtesting reveals that RSI oversold dips (<30) historically yield an average 20-day return of +1.13% with a 43.69% win rate (103 observations, Reliability: High), while volume spikes yield an average 20-day return of +1.87% (54.5% win rate).
Price sits 30.9% below All-Time High (796.0 set 49 sessions ago on 2026-09-07) and 30.9% below its 52-week high (796.0 on 2026-09-07).