


Misr Beni Suef Cement
MBSCMisr Beni Suef Cement Co. SAE
Company Overview & Activities
انتاج جميع أنواع الاسمنت وغيرها من المنتجات الاسمنتية او المرتبطة بها ومواد التغليف الخاصة بها وإنتاج مواد البناء ومستلزمات التشييد ، ويجوز للشركة ان تكون لها مصلحة او تشترك بأى وجه من الوجوه مع الشركات وغيرها التي تزاول اعمالا شبيه بأعمالها او التي قد تعاونها على تحقيق غرضها في مصر او الخارج كما يجوز بها ان تندمج في الهيئات السالفه او تشتريها او تلحقها بها وذلك طبقا لاحكام القانون ، ويجوز للشركة ان القيام بمشروعات أخرى او تعديل غرضها في حدود المجالات الواردة بالمادة الأولى من القانون رقم ( 8 ) لسنة 1997 بإصدار قانون ضمانات وحوافز الاستثمار وتلك المجالات التي يوافق مجلس الوزراء على اضافتها ويجوز لها ان تساهم او تشارك بأى وجه من الوجوه في مشروعات فرعية خارج قانون ضمانات وحوافز الاستثمار على ان يقتصر تمتع الشركة بالضمانات والحوافز الواردة بالقانون المشار اليه على نشاطها المتفق والمجالات المحددة بهذا القانون .
EGS3C371C019
1999-08-11
FRA Certified Auditor
Financial FAQ & Technical Outlook for Misr Beni Suef Cement Co. SAE (MBSC)
Quantitative Technical Engine (MBSC)
Misr Beni Suef Cement holds a Bullish technical posture (Overall Score: 66.2/100) with Trend Score 65/100, Momentum Score 100/100 (RSI 58.5 - Bullish Momentum), and Volume Score 45/100 (accumulating, 2.37x 20D baseline).
Support & Resistance Confluence Matrix
AlgorithmicNearest support is at 361.22 [Strength: 45.0/100, Tier 3 (Intraday 1-min)] (0.63% below price with a 100.0% confirmed bounce rate across 1 tests, Reliability: Low). Nearest resistance is at 364.62 [Strength: 45.0/100, Tier 3 (Intraday 1-min)] (0.31% above price with a 100.0% confirmed rejection rate across 1 tests, Reliability: Low).
Seasonal Trend & Historical Patterns (MBSC)
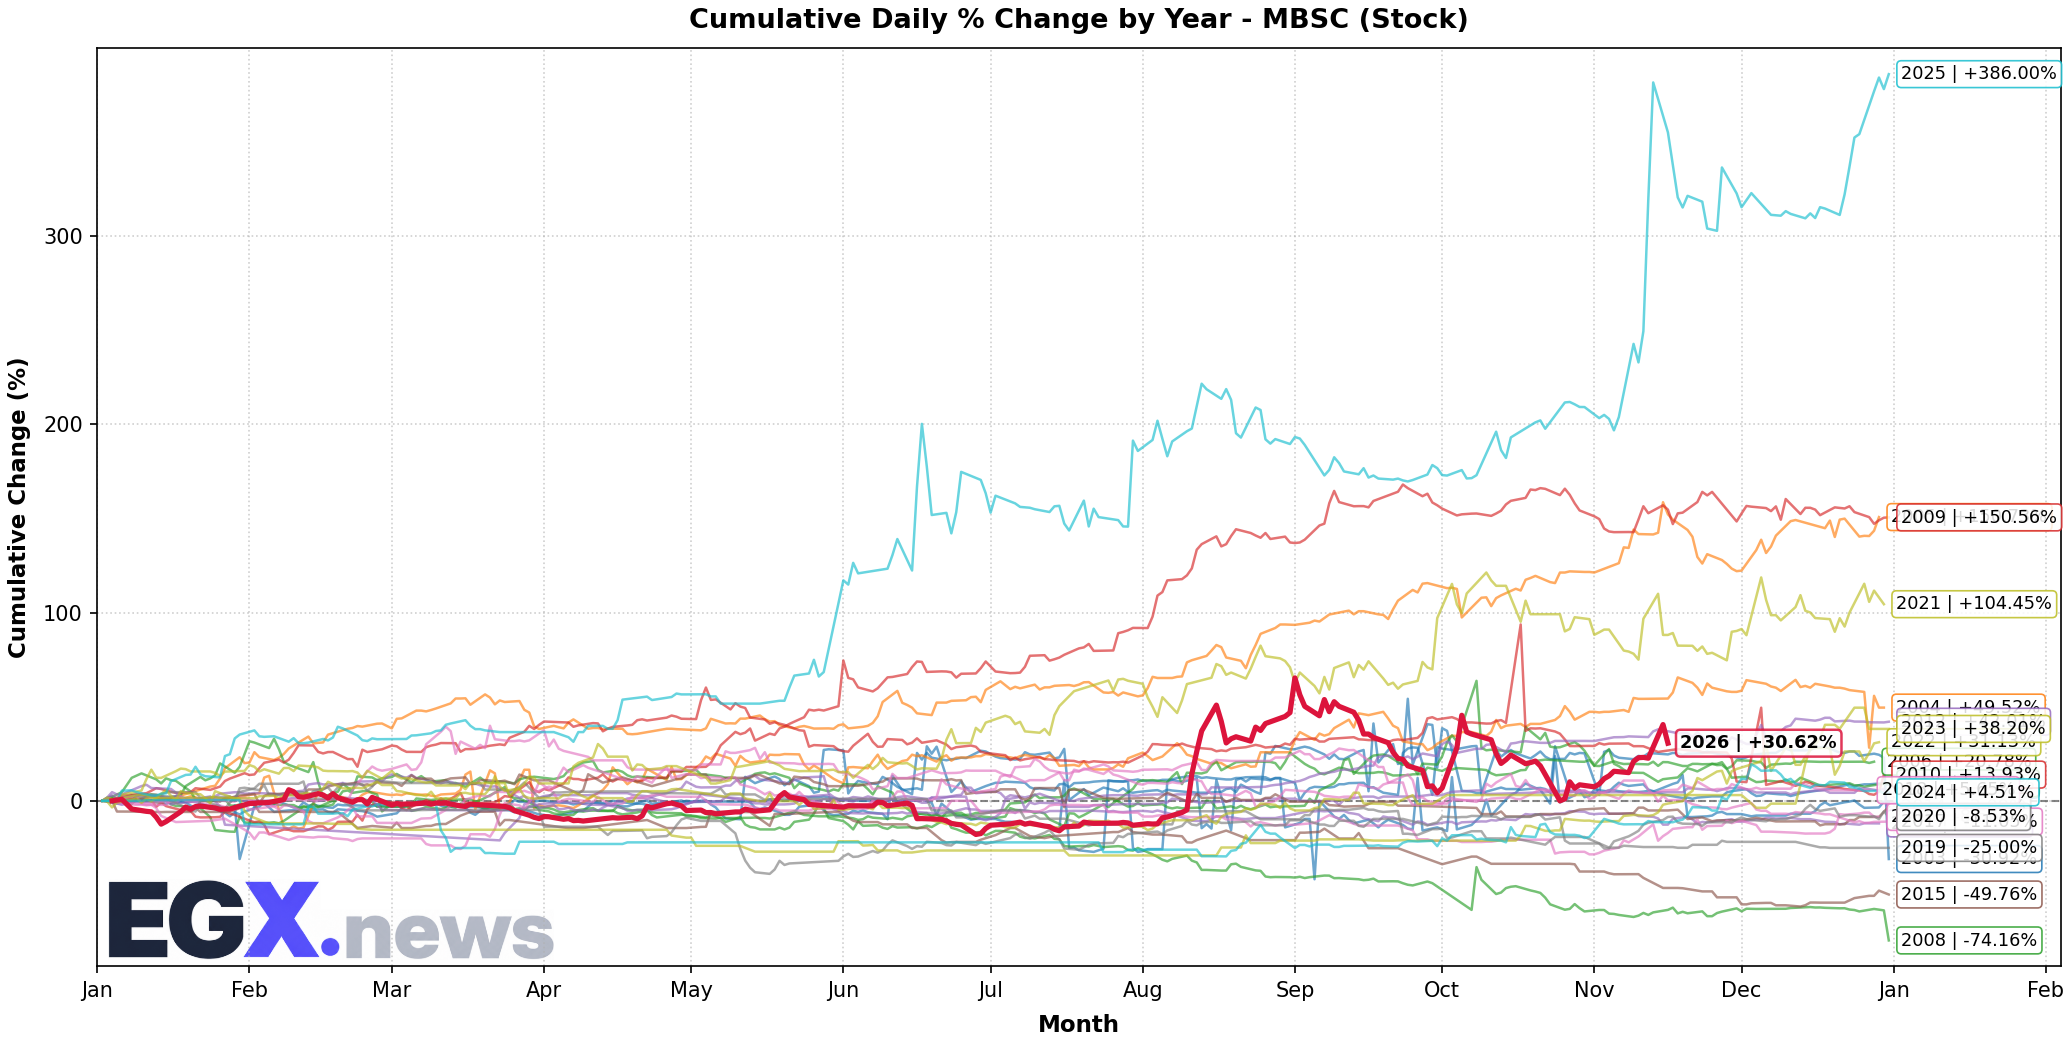
Click to EnlargeHistorical monthly seasonal return distribution and performance cycles for MBSC.
Trend Structure & Moving Averages
Golden Cross (469D)Trend Score is 65/100 with price trading 12.95% above its 20-day SMA and above the 200-day long-term benchmark (SMA50 is above SMA200 for 469 sessions).
Momentum, Volume Flow & Volatility
RSI(14) is 58.5 (Bullish Momentum), moving +4.18 over the past 5 sessions — indicating positive momentum in buyer territory. MACD line (6.282) is above signal line (-2.205) with a histogram of +8.487 (Bullish Momentum).
20-day annualized volatility is 86.65%, ATR(14) is 23.27 (6.4% of price), and price is trading near the upper band (%B: 0.883, Bandwidth: 33.86%).
Statistical Backtests & Historical Win Rates
BacktestedEmpirical backtesting reveals that RSI oversold dips (<30) historically yield an average 20-day return of +4.08% with a 60.0% win rate (105 observations, Reliability: High), while volume spikes yield an average 20-day return of +2.45% (55.76% win rate).
Price sits 22.66% below All-Time High (470.0 set 53 sessions ago on 2026-09-01) and 22.66% below its 52-week high (470.0 on 2026-09-01).