


Misr Kuwait Investment & Trading
MKITMisr Kuwait Investment & Trading Co.
Company Overview & Activities
الاستثمار العقارى وادارة وتشغيل وصيانة المبانى بكافة انواعها وانشاء وادارة المشروعات الصناعية والزراعية والقرى السياحية بكافة انواعها ومزاولة اعمال التجارة والتوريدات العمومية واستصلاح واستزراع الاراضى البور والصحراوية ... الخ .
EGS659O1C015
Listed on EGX
FRA Certified Auditor
Financial FAQ & Technical Outlook for Misr Kuwait Investment & Trading Co. (MKIT)
Quantitative Technical Engine (MKIT)
Misr Kuwait Investment & Trading holds a Bearish technical posture (Overall Score: 28.0/100) with Trend Score 0/100, Momentum Score 55/100 (RSI 16.74 - Oversold), and Volume Score 35/100 (distributing, 1.45x 20D baseline).
Support & Resistance Confluence Matrix
AlgorithmicNearest support is at 0.5 [Strength: 75.0/100, Tier 1 (Macro 500D)] (31.51% below price with a 100.0% confirmed bounce rate across 3 tests, Reliability: Low). Nearest resistance is at 0.85 [Strength: 45.0/100, Tier 3 (Intraday 1-min)] (16.44% above price with a 100.0% confirmed rejection rate across 1 tests, Reliability: Low).
Seasonal Trend & Historical Patterns (MKIT)
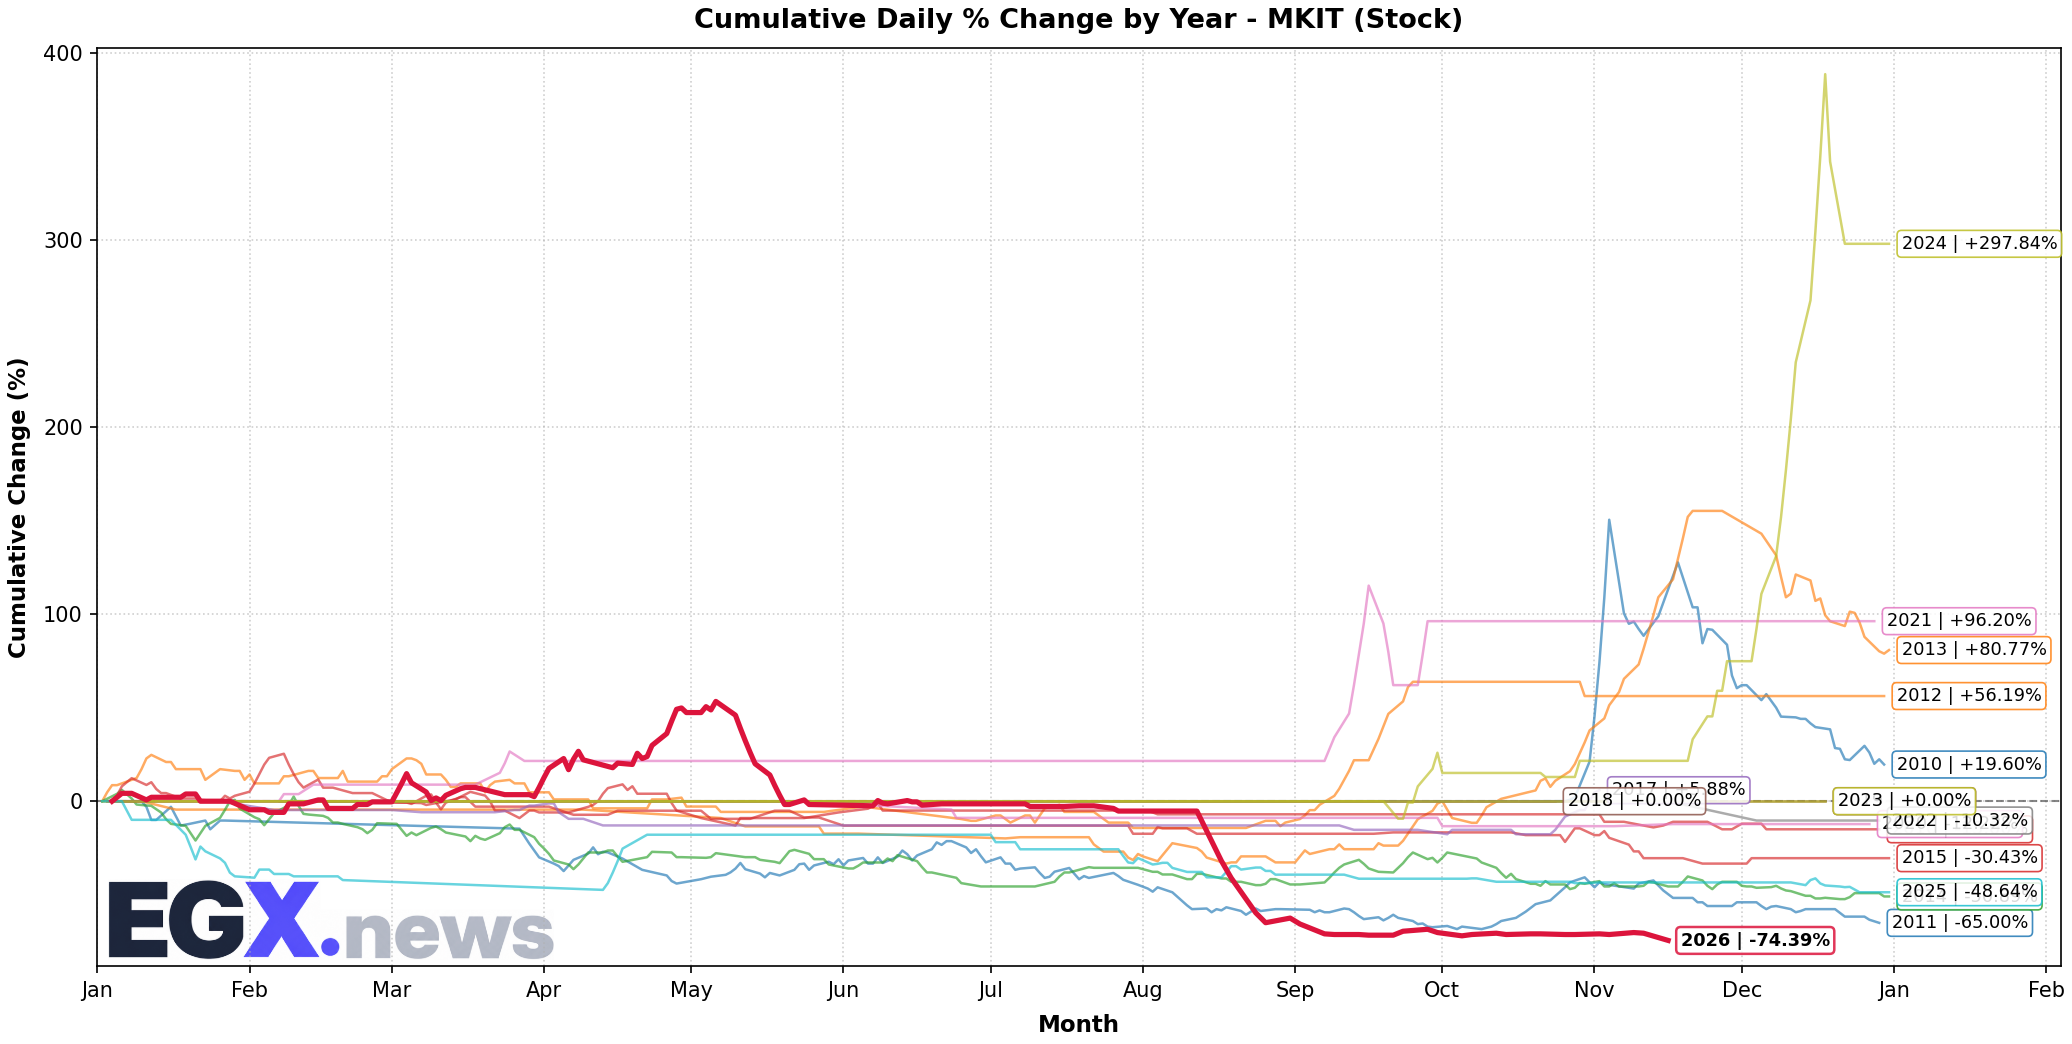
Click to EnlargeHistorical monthly seasonal return distribution and performance cycles for MKIT.
Trend Structure & Moving Averages
Trend Score is 0/100 with price trading 12.05% below its 20-day SMA and below the 200-day long-term benchmark (SMA50 is below SMA200).
Momentum, Volume Flow & Volatility
RSI(14) is 16.74 (Oversold), moving +1.38 over the past 5 sessions — signaling severe oversold conditions poised for a potential technical rebound. MACD line (-0.251) is above signal line (-0.314) with a histogram of +0.063 (Bullish Momentum).
20-day annualized volatility is 67.06%, ATR(14) is 0.11 (15.07% of price), and price is trading near the lower band (%B: -0.231, Bandwidth: 15.66%).
Statistical Backtests & Historical Win Rates
BacktestedEmpirical backtesting reveals that RSI oversold dips (<30) historically yield an average 20-day return of -2.19% with a 27.72% win rate (101 observations, Reliability: High), while volume spikes yield an average 20-day return of +4.33% (38.02% win rate).
Price sits 90.21% below All-Time High (7.46 set 345 sessions ago on 2024-12-19) and 83.33% below its 52-week high (4.38 on 2026-05-03).