


O B Financial
OFHO B Financial Holding
Company Overview & Activities
الاشتراك فى تاسيس الشركات التى تصدر اوراقا مالية او غى زيادة روس اموالها بمراعاة احكام قانون سوق راس المال يجوز للشركة ان تكون لها مصلحة او تشترك باى وجه من الوجوة مع شركات الاموال التى تزاول اعمال شبيهة لاعمالها او التى قد تعاونها على تحقيق غرضها فى مصر او فى الخارج كما يجوز لها ان تندمج فى هذه الشركات او تشتريها او تلحقها بها و ذلك طبقا لاحكام القانون ولائحتة التنفيذية
EGS696S1C016
2021-02-16
FRA Certified Auditor
Financial FAQ & Technical Outlook for O B Financial Holding (OFH)
Quantitative Technical Engine (OFH)
O B Financial holds a Bullish technical posture (Overall Score: 60.0/100) with Trend Score 50/100, Momentum Score 80/100 (RSI 43.08 - Neutral), and Volume Score 70/100 (accumulating, 1.43x 20D baseline).
Support & Resistance Confluence Matrix
AlgorithmicNearest support is at 0.73 [Strength: 45.0/100, Tier 3 (Intraday 1-min)] (1.35% below price with a 100.0% confirmed bounce rate across 1 tests, Reliability: Low). Nearest resistance is at 0.75 [Strength: 45.0/100, Tier 3 (Intraday 1-min)] (1.35% above price with a 100.0% confirmed rejection rate across 1 tests, Reliability: Low).
Seasonal Trend & Historical Patterns (OFH)
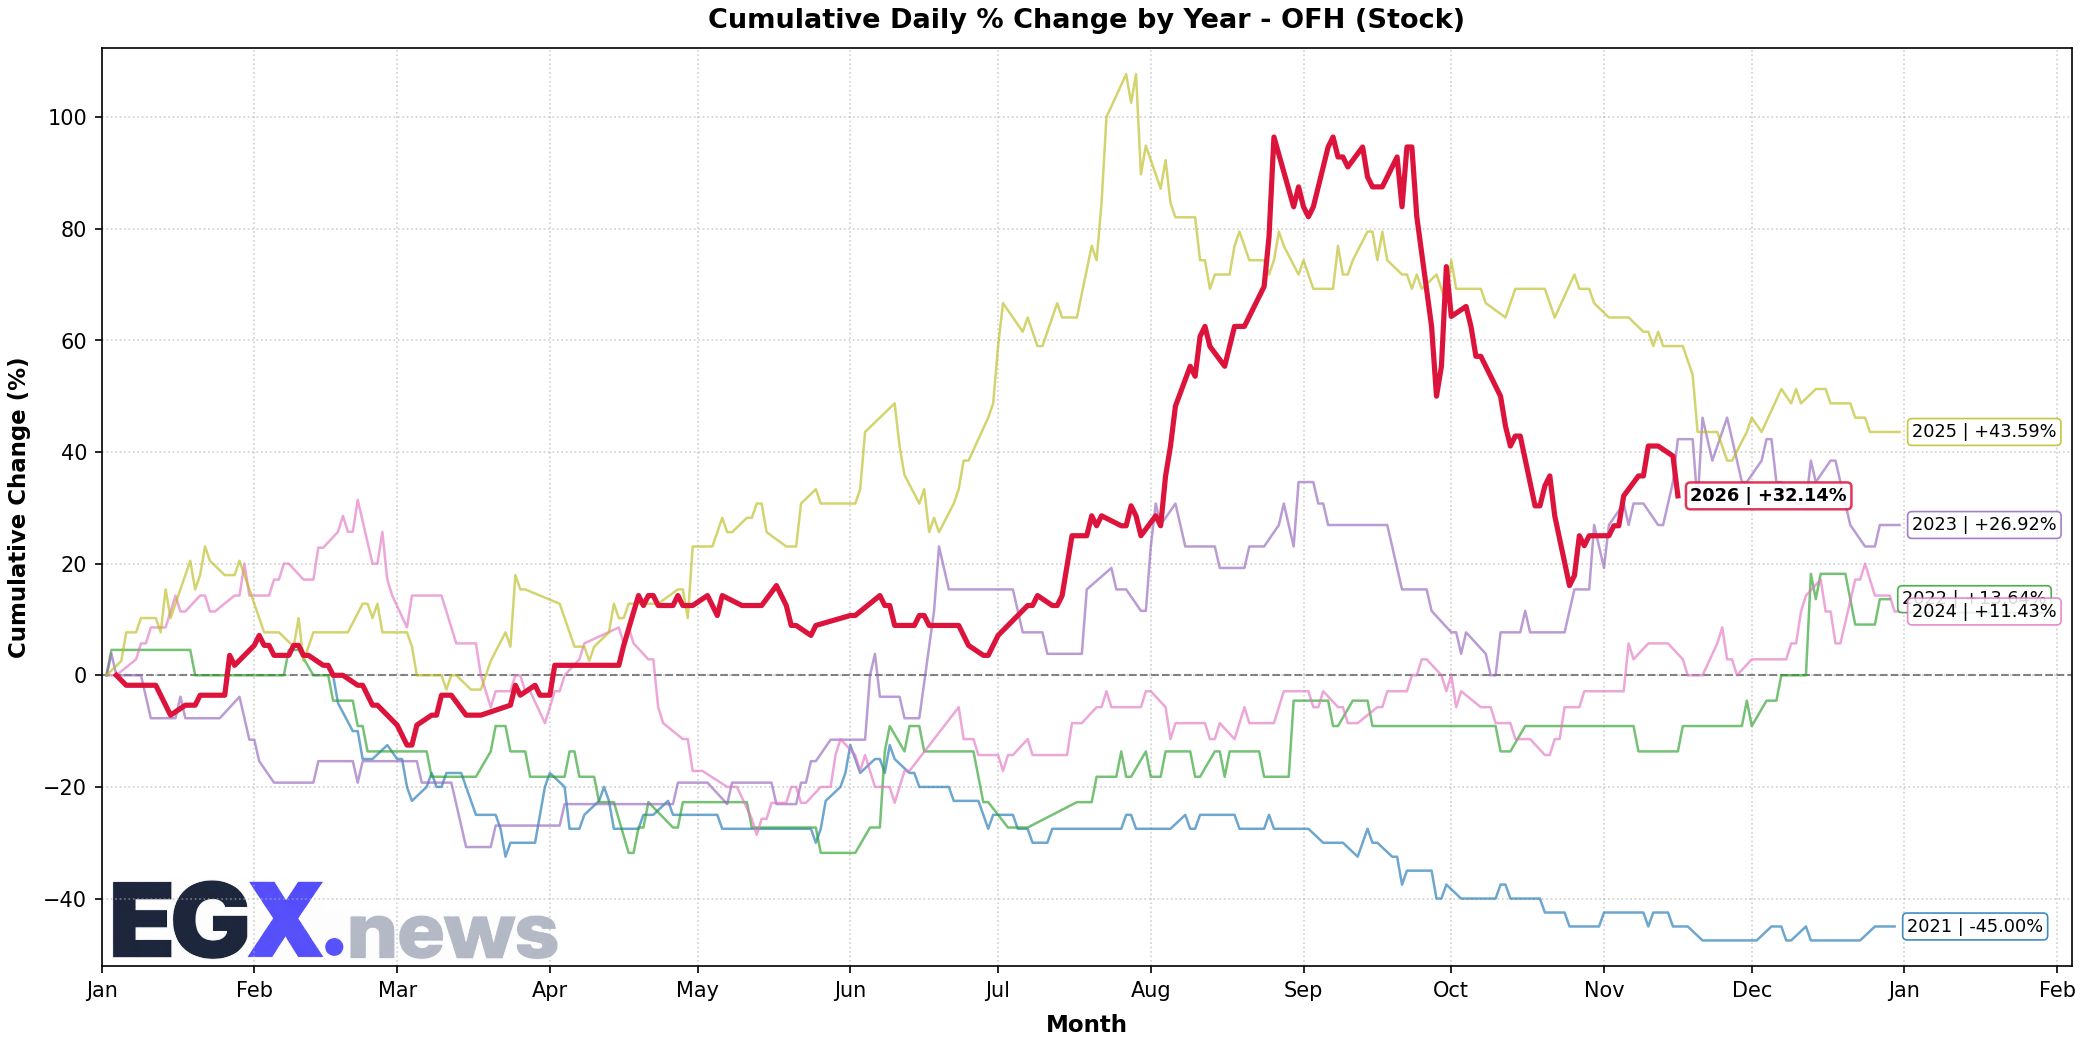
Click to EnlargeHistorical monthly seasonal return distribution and performance cycles for OFH.
Trend Structure & Moving Averages
Golden Cross (102D)Trend Score is 50/100 with price trading 1.37% above its 20-day SMA and above the 200-day long-term benchmark (SMA50 is above SMA200 for 102 sessions).
Momentum, Volume Flow & Volatility
RSI(14) is 43.08 (Neutral), moving -4.37 over the past 5 sessions — indicating a balanced / consolidation posture. MACD line (-0.016) is above signal line (-0.031) with a histogram of +0.014 (Bullish Momentum).
20-day annualized volatility is 57.01%, ATR(14) is 0.04 (5.41% of price), and price is trading in the middle channel (%B: 0.562, Bandwidth: 21.92%).
Statistical Backtests & Historical Win Rates
BacktestedEmpirical backtesting reveals that RSI oversold dips (<30) historically yield an average 20-day return of +1.52% with a 47.37% win rate (38 observations, Reliability: Moderate), while volume spikes yield an average 20-day return of +2.79% (52.0% win rate).
Price sits 37.29% below All-Time High (1.18 set 49 sessions ago on 2026-09-07) and 37.29% below its 52-week high (1.18 on 2026-09-07).