


Obour Land for Food Industries
OLFIObour Land for Food Industries
Company Overview & Activities
صناعة جميع منتجات الألبان وتشمل تعبئة وبسترة الألبان السائلة والقشطة و الزبدة والمسلي الطبيعي وجميع أنواع الجبن الأبيض والجبن الجاف والأجبان المطبوخة وجميع أنواع الزبادي وعلاوة علي صناعه أخري تندرج تحت منتجات الألبان . • وجميع أنواع الأيس كريم والمثلوجات والأيس لولي وبسكويت الأيس كريم . • صناعة وخلط مستحلبات ومثبتات الأيس كريم . • وعصائر الفاكهة الطبيعية . • استيراد جميع مستلزمات الإنتاج التي تخص نشاط الشركة وكذلك تصدير المنتجات . • صناعة المسلي الصناعي وجميع أصناف الحلوى . • وتربية الماشية لإنتاج الألبان والتسمين . مع مراعاة أحكام القوانين السارية وبشرط استصدار التراخيص اللازمة لممارسة النشاط ويجوز للشركة أن تكون لها مصلحة أو تشترك بأي وجه من الوجوه مع الشركات وغيرها التي تزاول أعمالا شبيهة بأعمالها أو التي قد تعاونها علي تحقيق غرضها في مصر أو في الخارج ، كما يجوز لها أن تندمج في الهيئات السالفة أو تشتريها أو تلحقها بها وذلك طبقاً لأحكام القانون ولائحته التنفيذية .
EGS30AL1C012
2016-09-29
FRA Certified Auditor
Financial FAQ & Technical Outlook for Obour Land for Food Industries (OLFI)
Quantitative Technical Engine (OLFI)
Obour Land for Food Industries holds a Neutral technical posture (Overall Score: 59.0/100) with Trend Score 30/100, Momentum Score 100/100 (RSI 56.0 - Bullish Momentum), and Volume Score 70/100 (accumulating, 0.55x 20D baseline).
Support & Resistance Confluence Matrix
AlgorithmicNearest support is at 20.55 [Strength: 58.8/100, Tier 3 (Intraday 1-min)] (1.01% below price with a 75.0% confirmed bounce rate across 28 tests, Reliability: High). Nearest resistance is at 20.89 [Strength: 53.9/100, Tier 3 (Intraday 1-min)] (0.63% above price with a 55.6% confirmed rejection rate across 45 tests, Reliability: High).
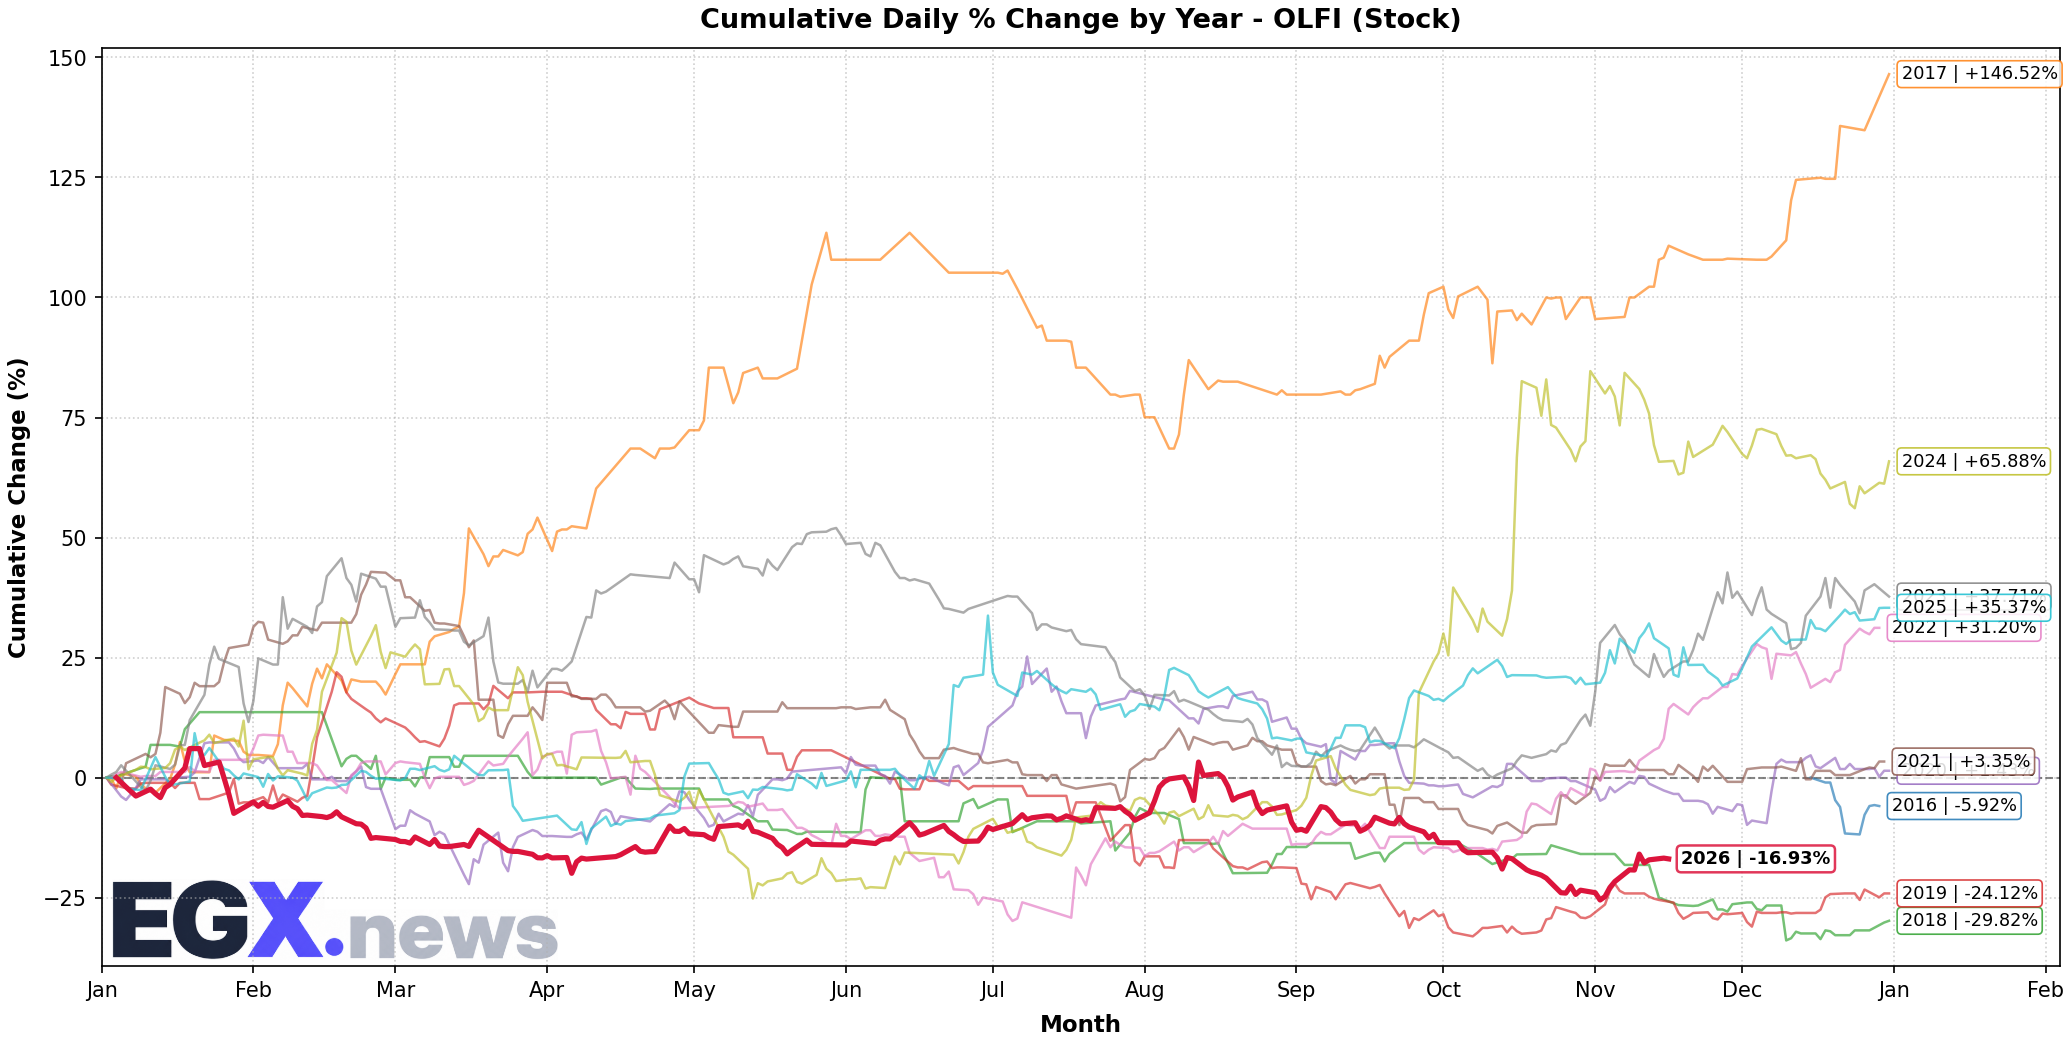
Seasonal Trend & Historical Patterns (OLFI)
Click to EnlargeHistorical monthly seasonal return distribution and performance cycles for OLFI.
Trend Structure & Moving Averages
Trend Score is 30/100 with price trading 5.22% above its 20-day SMA and below the 200-day long-term benchmark (SMA50 is below SMA200).
Momentum, Volume Flow & Volatility
RSI(14) is 56.0 (Bullish Momentum), moving +5.07 over the past 5 sessions — indicating positive momentum in buyer territory. MACD line (-0.037) is above signal line (-0.316) with a histogram of +0.279 (Bullish Momentum).
20-day annualized volatility is 30.77%, ATR(14) is 0.73 (3.52% of price), and price is trading near the upper band (%B: 0.837, Bandwidth: 15.56%).
Statistical Backtests & Historical Win Rates
BacktestedEmpirical backtesting reveals that RSI oversold dips (<30) historically yield an average 20-day return of -0.35% with a 44.62% win rate (65 observations, Reliability: Good), while volume spikes yield an average 20-day return of +2.21% (52.81% win rate).
Price sits 21.72% below All-Time High (26.52 set 72 sessions ago on 2026-08-04) and 21.72% below its 52-week high (26.52 on 2026-08-04).