


October Pharma
OCPHOctober Pharma Co.
Company Overview & Activities
أكتوبر فارما هي واحدة من أكبر أربعين شركة أدوية في السوق المصري، تأسست عام 1987 وبدأت إنتاجها الأول عام 1992 في المنطقة الصناعية الأولى، مدينة 6 أكتوبر، قطعة 190 شارع 25. تم بناء المصنع على مساحة 7,205 متراً مربعاً تمثل 48% من إجمالي الأراضي وتلبي أعلى معايير الجودة وفقًا لإرشادات GMP (إجراءات التصنيع الجيد) مع مركز أبحاث وتطوير عالي المهارة يحافظ على محفظتنا الحالية من الأدوية . نقوم بتطوير منتجات مبتكرة بجميع الأشكال الصيدلانيه تلبي احتياجات الرعاية الصحية للأشخاص في جميع أنحاء العالم. ونتيجة لذلك، أصبح لدينا الآن انتشار عالمي، حيث نقوم بالتصدير إلى أكثر من 25 دولة في جميع أنحاء العالم.
EGS380R1C018
2005-02-23
FRA Certified Auditor
Financial FAQ & Technical Outlook for October Pharma Co. (OCPH)
Quantitative Technical Engine (OCPH)
October Pharma holds a Neutral technical posture (Overall Score: 51.0/100) with Trend Score 30/100, Momentum Score 90/100 (RSI 54.9 - Bullish Momentum), and Volume Score 45/100 (accumulating, 1.74x 20D baseline).
Support & Resistance Confluence Matrix
AlgorithmicNearest support is at 206.36 [Strength: 45.0/100, Tier 3 (Intraday 1-min)] (0.87% below price with a 100.0% confirmed bounce rate across 1 tests, Reliability: Low). Nearest resistance is at 209.55 [Strength: 45.0/100, Tier 3 (Intraday 1-min)] (0.66% above price with a 100.0% confirmed rejection rate across 1 tests, Reliability: Low).
Seasonal Trend & Historical Patterns (OCPH)
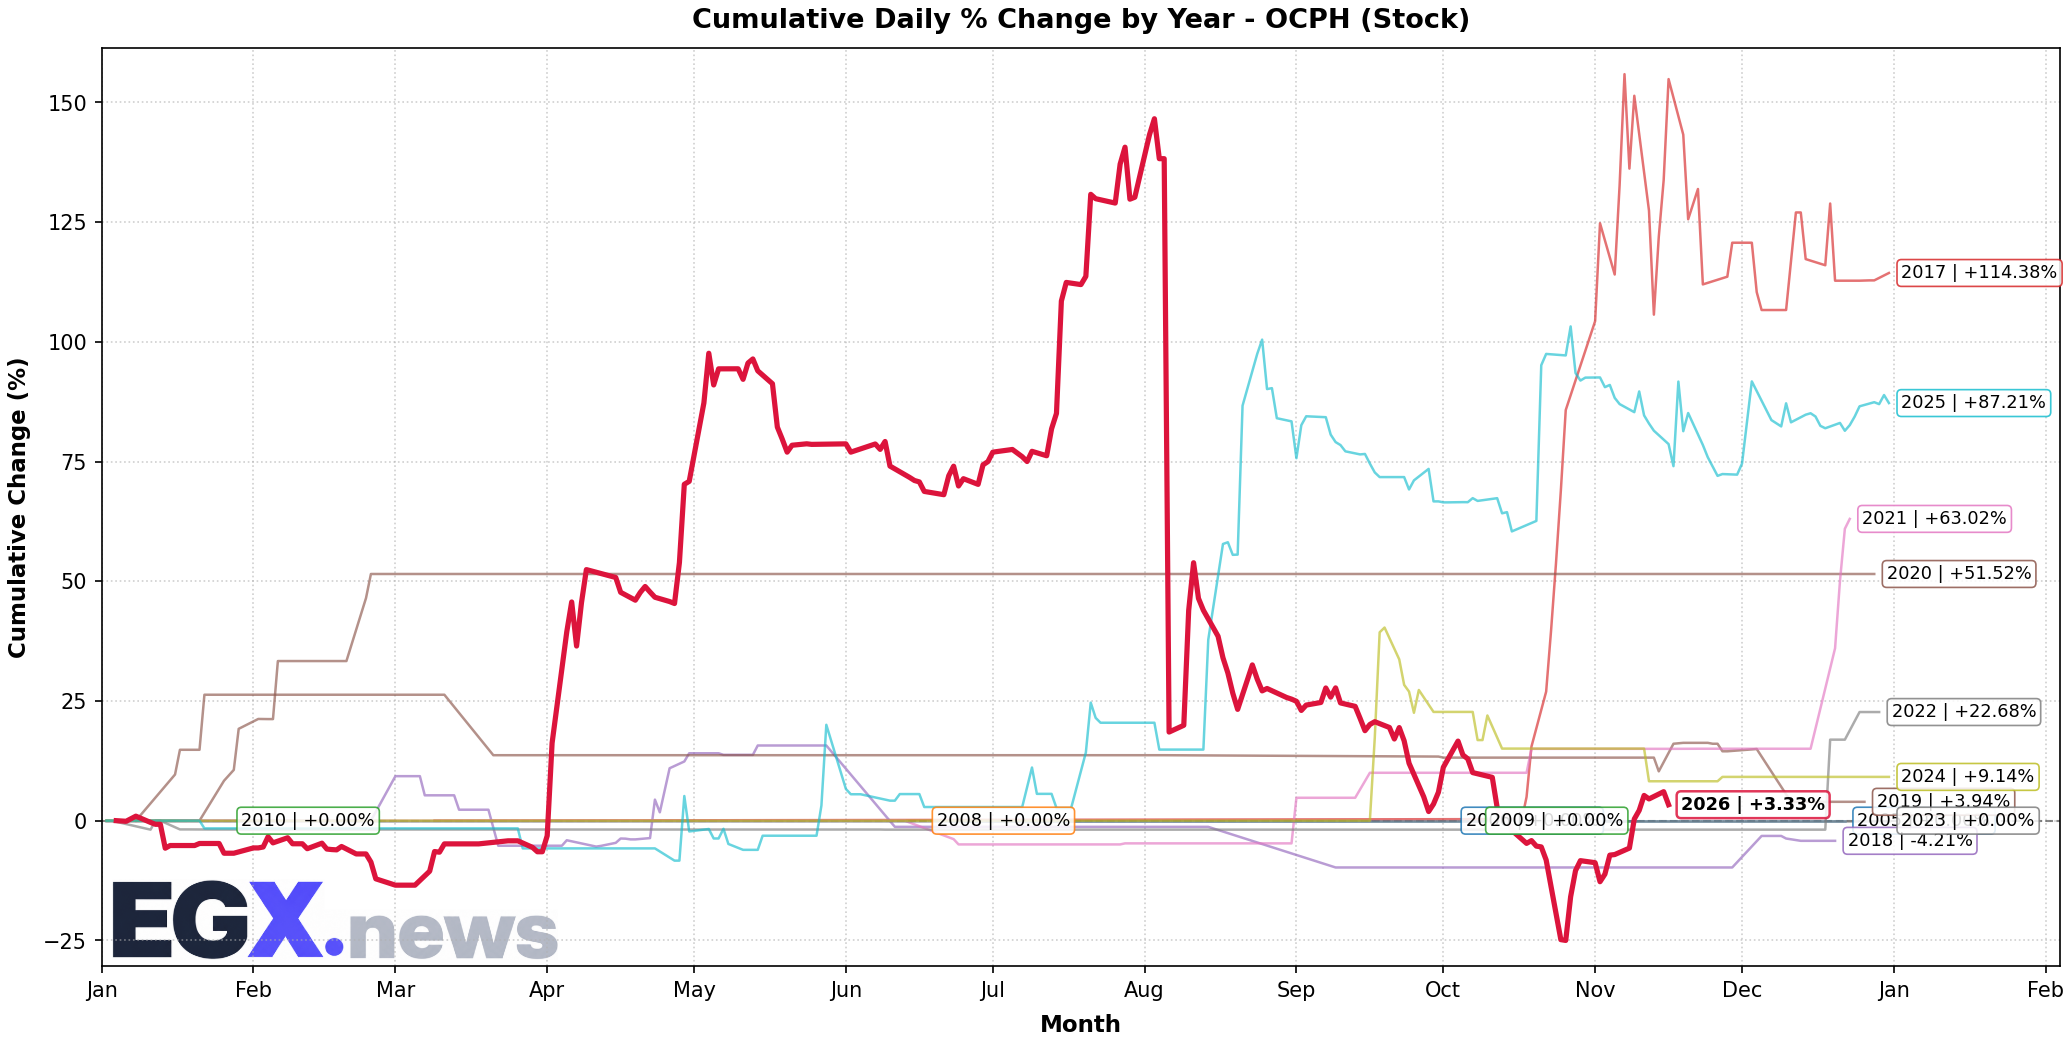
Click to EnlargeHistorical monthly seasonal return distribution and performance cycles for OCPH.
Trend Structure & Moving Averages
Trend Score is 30/100 with price trading 10.78% above its 20-day SMA and below the 200-day long-term benchmark (SMA50 is below SMA200).
Momentum, Volume Flow & Volatility
RSI(14) is 54.9 (Bullish Momentum), moving +1.63 over the past 5 sessions — indicating positive momentum in buyer territory. MACD line (-0.021) is above signal line (-5.739) with a histogram of +5.718 (Bullish Momentum).
20-day annualized volatility is 91.85%, ATR(14) is 15.48 (7.44% of price), and price is trading in the middle channel (%B: 0.784, Bandwidth: 38.03%).
Statistical Backtests & Historical Win Rates
BacktestedEmpirical backtesting reveals that RSI oversold dips (<30) historically yield an average 20-day return of +48.90% with a 50.0% win rate (24 observations, Reliability: Moderate), while volume spikes yield an average 20-day return of +6.90% (38.2% win rate).
Price sits 58.77% below All-Time High (504.98 set 73 sessions ago on 2026-08-03) and 58.77% below its 52-week high (504.98 on 2026-08-03).