


ODIN Investments
ODINODIN Investments
Company Overview & Activities
• الإشتراك في تأسيس الشركات التي تصدر أوراقاً مالية أو في زيادة رؤوس أموالها. • الترويج وتغطية الإكتتاب في الأوراق المالية. • رأس المال المخاطر. ويجوز للشركة أن تكون لها مصلحة أو أن تشترك بأي وجه من الوجوه مع شركات الأموال التي تزاول أعمالاً بأعمالها أو التي قد تعاونها علي تحقيق غرضها في مصر أو في الخارج، كما يجوز لها أن تندمج في هذه الشركات أو تشتريها أو تلحقها بها وذلك طبقاً لأحكام القانون 95 لسنة 1992 ولائحته التنفيذية وفي إطار موافقة الهيئة العامة للإستثمار والهيئة العامة لسوق المال مع مراعاة أن تقوم الشركة عند إدارة محفظة أحد عملائها بإخطاره إذا تضمنت الأوراق المالية المشتراه لحسابه أوراق أحد الشركات التي تقوم الشركة الشركة بترويجها وتغطية أوراقها.
EGS67181C015
1986-09-30
FRA Certified Auditor
Financial FAQ & Technical Outlook for ODIN Investments (ODIN)
Quantitative Technical Engine (ODIN)
ODIN Investments holds a Neutral technical posture (Overall Score: 51.2/100) with Trend Score 25/100, Momentum Score 80/100 (RSI 45.55 - Neutral), and Volume Score 70/100 (accumulating, 0.65x 20D baseline).
Support & Resistance Confluence Matrix
AlgorithmicNearest support is at 2.08 [Strength: 45.0/100, Tier 3 (Intraday 1-min)] (1.89% below price with a 100.0% confirmed bounce rate across 1 tests, Reliability: Low). Nearest resistance is at 2.13 [Strength: 81.1/100, Tier 1 (Macro 500D)] (0.47% above price with a 84.4% confirmed rejection rate across 32 tests, Reliability: High).
Seasonal Trend & Historical Patterns (ODIN)
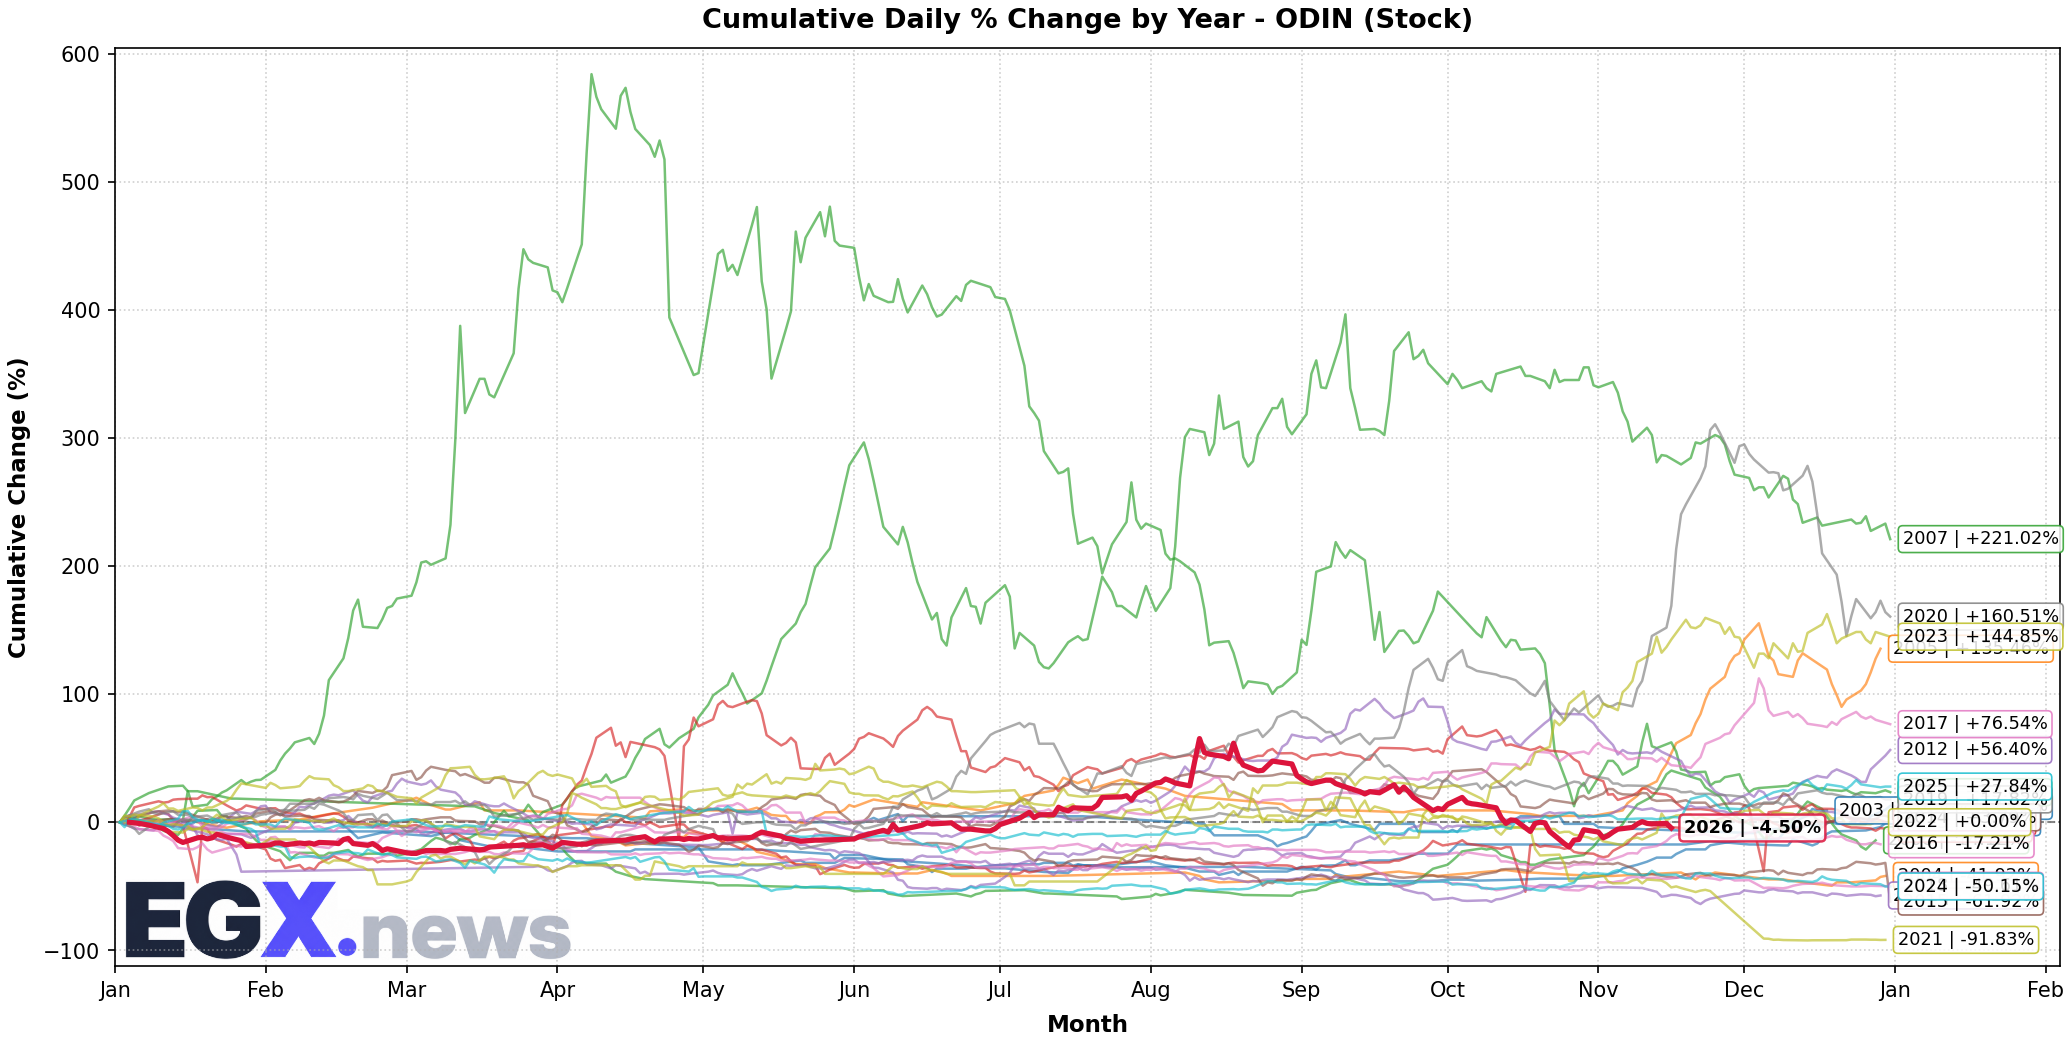
Click to EnlargeHistorical monthly seasonal return distribution and performance cycles for ODIN.
Trend Structure & Moving Averages
Golden Cross (242D)Trend Score is 25/100 with price trading 2.42% above its 20-day SMA and below the 200-day long-term benchmark (SMA50 is above SMA200 for 242 sessions).
Momentum, Volume Flow & Volatility
RSI(14) is 45.55 (Neutral), moving -4.11 over the past 5 sessions — indicating a balanced / consolidation posture. MACD line (-0.048) is above signal line (-0.088) with a histogram of +0.040 (Bullish Momentum).
20-day annualized volatility is 69.14%, ATR(14) is 0.13 (6.13% of price), and price is trading in the middle channel (%B: 0.585, Bandwidth: 25.6%).
Statistical Backtests & Historical Win Rates
BacktestedEmpirical backtesting reveals that RSI oversold dips (<30) historically yield an average 20-day return of +2.26% with a 54.69% win rate (128 observations, Reliability: High), while volume spikes yield an average 20-day return of +4.64% (48.57% win rate).
Price sits 97.06% below All-Time High (72.17 set 4465 sessions ago on 2008-04-08) and 45.92% below its 52-week high (3.92 on 2026-08-11).