


Qatar National Bank
QNBEQatar National Bank
Company Overview & Activities
بنك كيو ان بي مصر هو واحد من المؤسسات المالية الرائدة في مصر التي تم تأسيسها في أبريل 1978 ، وتم تصنيفه كثاني أكبر بنك خاص في مصر. يقدم البنك خدماته لأكثر من 1,909,953 عميل يخدمهم أكثر من 7,489 مصرفي متخصص من خلال شبكه فروع تغطى كافة محافظات مصر تصل الى أكثر من 235 فرع بالإضافة إلى شبكة ممتدة من947جهاز صراف آلي وأكثر من 40,732 نقطة بيع لخدمة العملاء، علاوة على ذلك، تعمل خدمة العملاء المميزة) مركز الاتصال (على مدار الساعة 7 أيام في الأسبوع. أنشأ البنك عددا من الشركات التابعة في مجالات متخصصة مثل كيو ان بي للتأجير التمويلي والتي تأسست في عام 1997 كواحدة من أوائل الوافدين لسوق التأجير التمويلي المصري. تم تأسيس كيو ان بي لتأمينات الحياة في عام 2003 لتوفير مجموعة متنوعة من المنتجات لتلبية احتياجات العملاء للتأمين على الحياة والادخار.كيو ان بي للتخصيم تأسست عام 2012 كمؤسسة مالية تشارك في جميع أنواع خدمات التخصيم المحلية والدولية.
EGS60081C014
1996-07-03
FRA Certified Auditor
Financial FAQ & Technical Outlook for Qatar National Bank (QNBE)
Quantitative Technical Engine (QNBE)
Qatar National Bank holds a Bullish technical posture (Overall Score: 68.2/100) with Trend Score 65/100, Momentum Score 90/100 (RSI 54.56 - Bullish Momentum), and Volume Score 70/100 (accumulating, 0.61x 20D baseline).
Support & Resistance Confluence Matrix
AlgorithmicNearest support is at 55.9 [Strength: 45.0/100, Tier 3 (Intraday 1-min)] (1.06% below price with a 100.0% confirmed bounce rate across 1 tests, Reliability: Low). Nearest resistance is at 57.08 [Strength: 45.0/100, Tier 3 (Intraday 1-min)] (1.03% above price with a 100.0% confirmed rejection rate across 1 tests, Reliability: Low).
Seasonal Trend & Historical Patterns (QNBE)
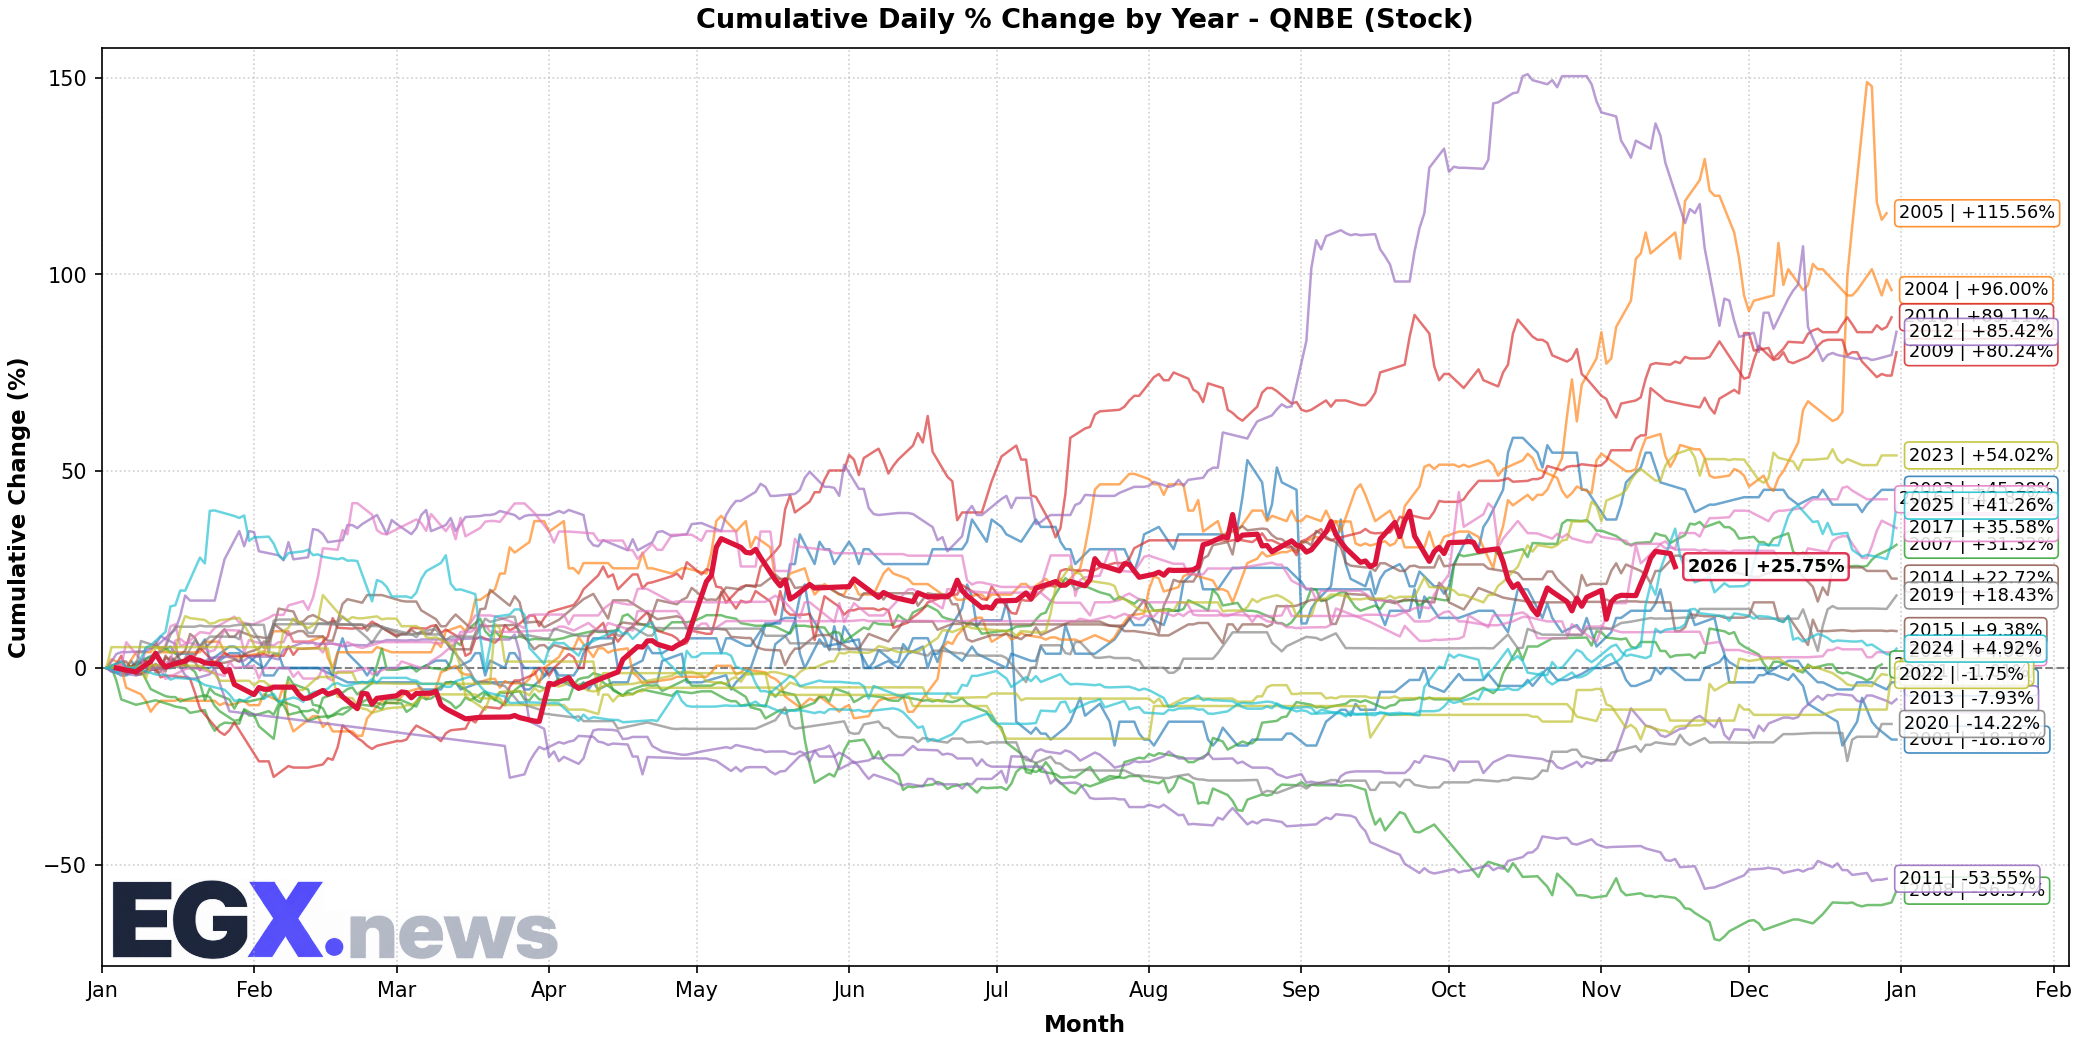
Click to EnlargeHistorical monthly seasonal return distribution and performance cycles for QNBE.
Trend Structure & Moving Averages
Golden Cross (242D)Trend Score is 65/100 with price trading 4.73% above its 20-day SMA and above the 200-day long-term benchmark (SMA50 is above SMA200 for 242 sessions).
Momentum, Volume Flow & Volatility
RSI(14) is 54.56 (Bullish Momentum), moving +3.58 over the past 5 sessions — indicating positive momentum in buyer territory. MACD line (0.345) is above signal line (-0.401) with a histogram of +0.745 (Bullish Momentum).
20-day annualized volatility is 40.15%, ATR(14) is 2.03 (3.59% of price), and price is trading in the middle channel (%B: 0.792, Bandwidth: 16.14%).
Statistical Backtests & Historical Win Rates
BacktestedEmpirical backtesting reveals that RSI oversold dips (<30) historically yield an average 20-day return of +0.47% with a 44.86% win rate (107 observations, Reliability: High), while volume spikes yield an average 20-day return of +2.15% (52.88% win rate).
Price sits 11.72% below All-Time High (64.0 set 37 sessions ago on 2026-09-23) and 11.72% below its 52-week high (64.0 on 2026-09-23).