


Raya Contact Center
RACCRaya Contact Center
Company Overview & Activities
1-تصميم و تطوير البرمجيات و نظم التشغيل و النظم المدمجة و ادخال البيانات على الحاسبات بالوسائل الالكترونية و انشاء قواعد البيانات و نظم المعلومات الالكترونية و انتاج المحتوى الالكترونى بصورة المختلفة من صوت و صورة و بيانات . 2-اقامة شبكات نقل الصوت و الصورة و المعلومات المكتوبة و تقديم خدمات القيمة المضافة بعد الحصول على التراخيص من الجهات المعنية وفقا للقوانين المعمول بها و لا يشمل ذلك شبكات الهاتف المحمول . و على الشركة الحصول على كافة التراخيص اللازمة لمباشرة نشاطها .
EGS74191C015
2015-02-11
FRA Certified Auditor
Financial FAQ & Technical Outlook for Raya Contact Center (RACC)
Quantitative Technical Engine (RACC)
Raya Contact Center holds a Neutral technical posture (Overall Score: 52.2/100) with Trend Score 15/100, Momentum Score 80/100 (RSI 48.82 - Neutral), and Volume Score 70/100 (accumulating, 0.51x 20D baseline).
Support & Resistance Confluence Matrix
AlgorithmicNearest support is at 8.1 [Strength: 61.7/100, Tier 3 (Intraday 1-min)] (0.37% below price with a 86.7% confirmed bounce rate across 15 tests, Reliability: High). Nearest resistance is at 8.19 [Strength: 45.0/100, Tier 3 (Intraday 1-min)] (0.74% above price with a 100.0% confirmed rejection rate across 1 tests, Reliability: Low).
Seasonal Trend & Historical Patterns (RACC)
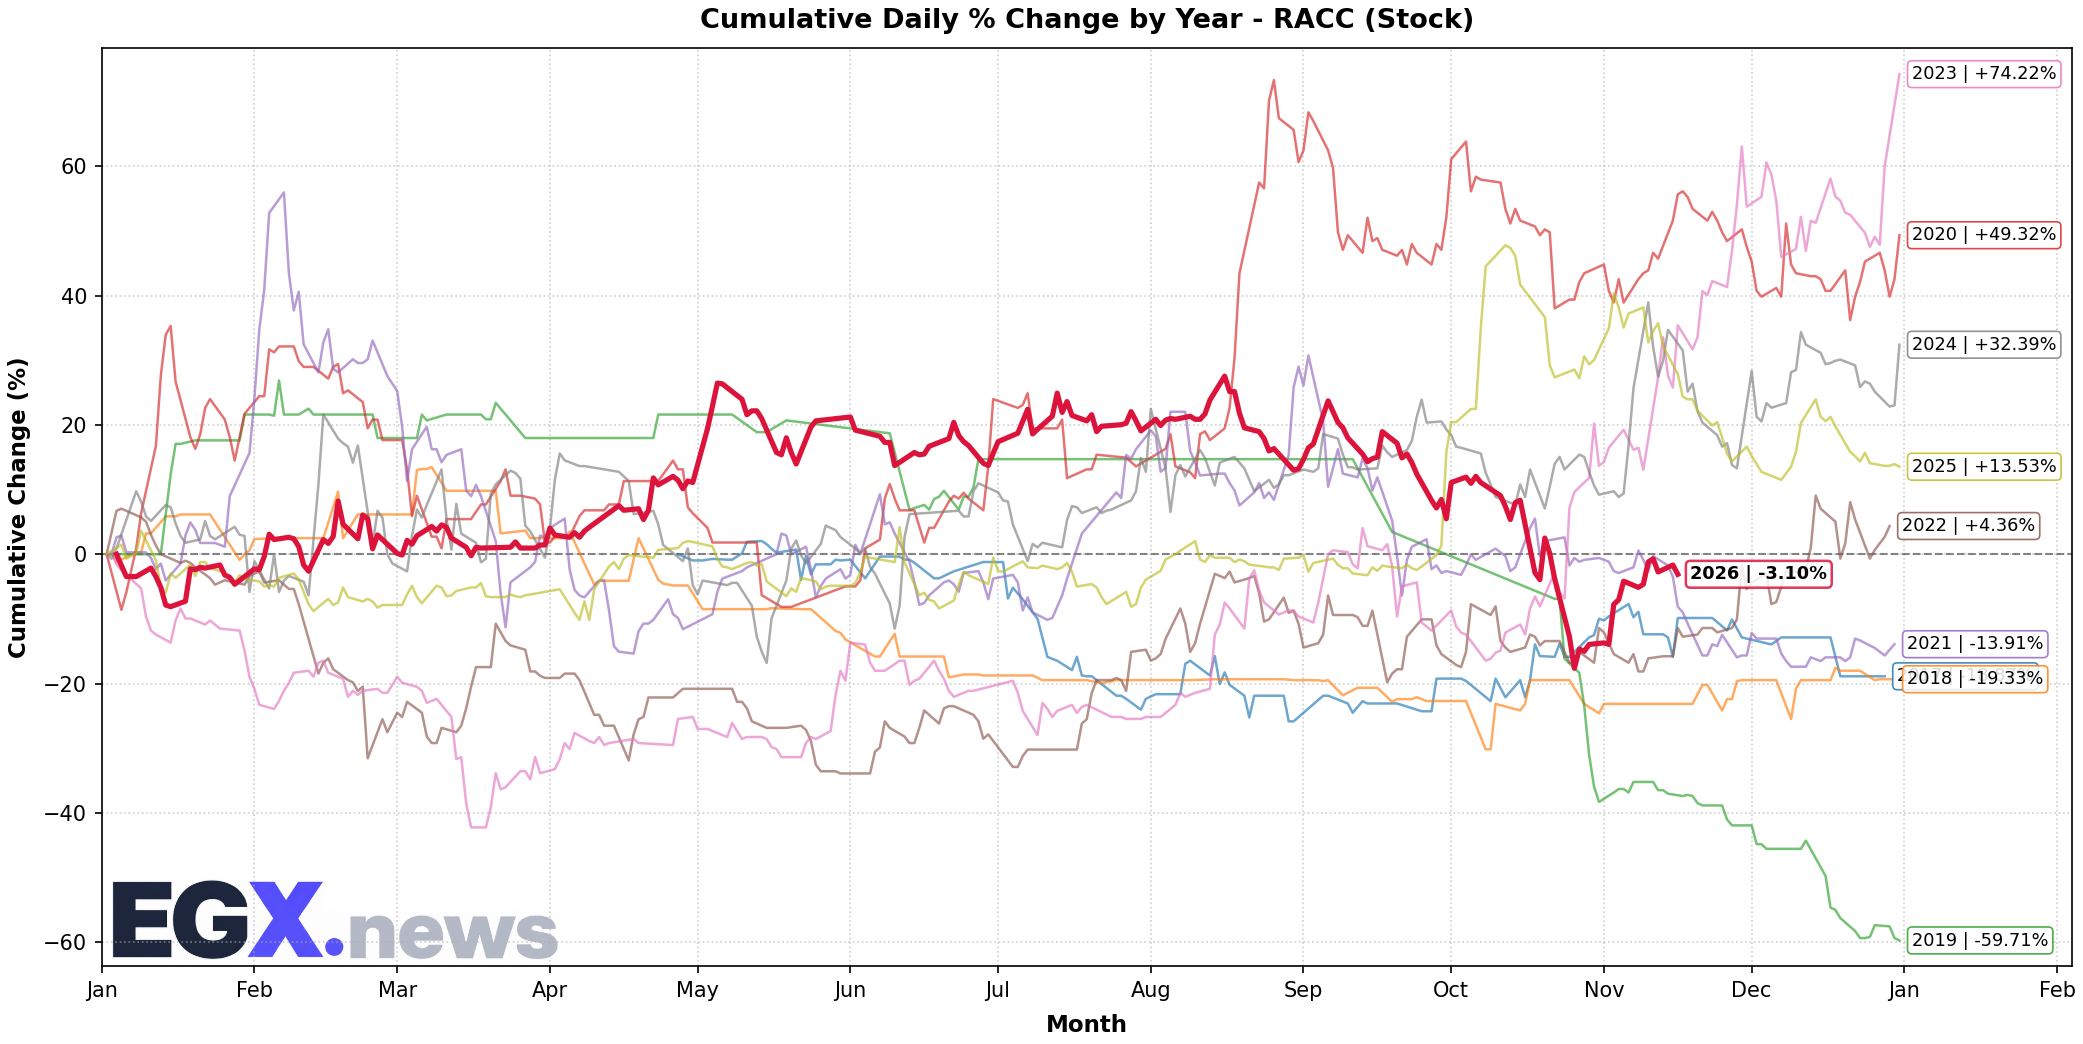
Click to EnlargeHistorical monthly seasonal return distribution and performance cycles for RACC.
Trend Structure & Moving Averages
Trend Score is 15/100 with price trading 4.23% above its 20-day SMA and below the 200-day long-term benchmark (SMA50 is below SMA200).
Momentum, Volume Flow & Volatility
RSI(14) is 48.82 (Neutral), moving +2.02 over the past 5 sessions — indicating a balanced / consolidation posture. MACD line (-0.13) is above signal line (-0.267) with a histogram of +0.137 (Bullish Momentum).
20-day annualized volatility is 61.19%, ATR(14) is 0.39 (4.8% of price), and price is trading in the middle channel (%B: 0.66, Bandwidth: 26.41%).
Statistical Backtests & Historical Win Rates
BacktestedEmpirical backtesting reveals that RSI oversold dips (<30) historically yield an average 20-day return of -2.05% with a 42.0% win rate (50 observations, Reliability: Good), while volume spikes yield an average 20-day return of +2.02% (47.83% win rate).
Price sits 32.36% below All-Time High (12.02 set 121 sessions ago on 2026-05-12) and 32.36% below its 52-week high (12.02 on 2026-05-12).