


Saudi Egyptian Investment & Finance
SEIGSaudi Egyptian Investment & Finance Co. SAE
Company Overview & Activities
1-قطاع الاسكان والتشييد والبناء :- مشروعات الاسكان الاجتماعي ومشروعات الاسكان الموجهة لمحدودي الدخل ، والاستثمار العقاري بالمدن والمجتمعات العمرانية الجديدة والمناطق النائية والتطوير والتسويق العقاري والمقاولات العامة . 2-قطاع الزراعة والانتاج الحيواني والداجني والسمكي :- استصلاح واستزراع الاراضي وتجهيزها بالمرافق الاساسية التي تجعلها قابلة للاستزراع ، واستزراع الاراضي المستصلحة ( في حدود الف فدان ) ويشترط في هاتين الحالتين ان تكون الاراضي مخصصة لاغراض الاستصلاح والاستزراع وان تستخدم طرق الري الحديثة وليس بالغمر . - تربية جميع انواع الحيوانات . - تربية جميع انواع الدواجن والطيور . - المزارع السمكية. 3-قطاع الرياضة :- جميع الخدمات التي تقدم من خلال المجال الرياضي سواء كان ذلك في صورة الادارة او التسويق او التشغيل او ادارة الالعاب الرياضية او انشاء الاندية الخاصة او الاكاديميات او الاندية الصحية او مراكز اللياقة البدنية . 4--قطاع السياحة :- انشاء و ادارة و تشغيل القري السياحية و الفنادق الثابتة والموتيلات والشقق والاجنحة الفندقية والانشطة المكملة او المرتبطة بذلك سو
EGS67031C012
1992-04-07
FRA Certified Auditor
Financial FAQ & Technical Outlook for Saudi Egyptian Investment & Finance Co. SAE (SEIG)
Quantitative Technical Engine (SEIG)
Saudi Egyptian Investment & Finance holds a Bullish technical posture (Overall Score: 66.8/100) with Trend Score 65/100, Momentum Score 70/100 (RSI 52.41 - Bullish Momentum), and Volume Score 70/100 (accumulating, 0.34x 20D baseline).
Support & Resistance Confluence Matrix
AlgorithmicNearest support is at 228.36 [Strength: 83.6/100, Tier 1 (Macro 500D)] (0.05% below price with a 94.4% confirmed bounce rate across 18 tests, Reliability: High). Nearest resistance is at 229.97 [Strength: 45.0/100, Tier 3 (Intraday 1-min)] (0.65% above price with a 100.0% confirmed rejection rate across 1 tests, Reliability: Low).
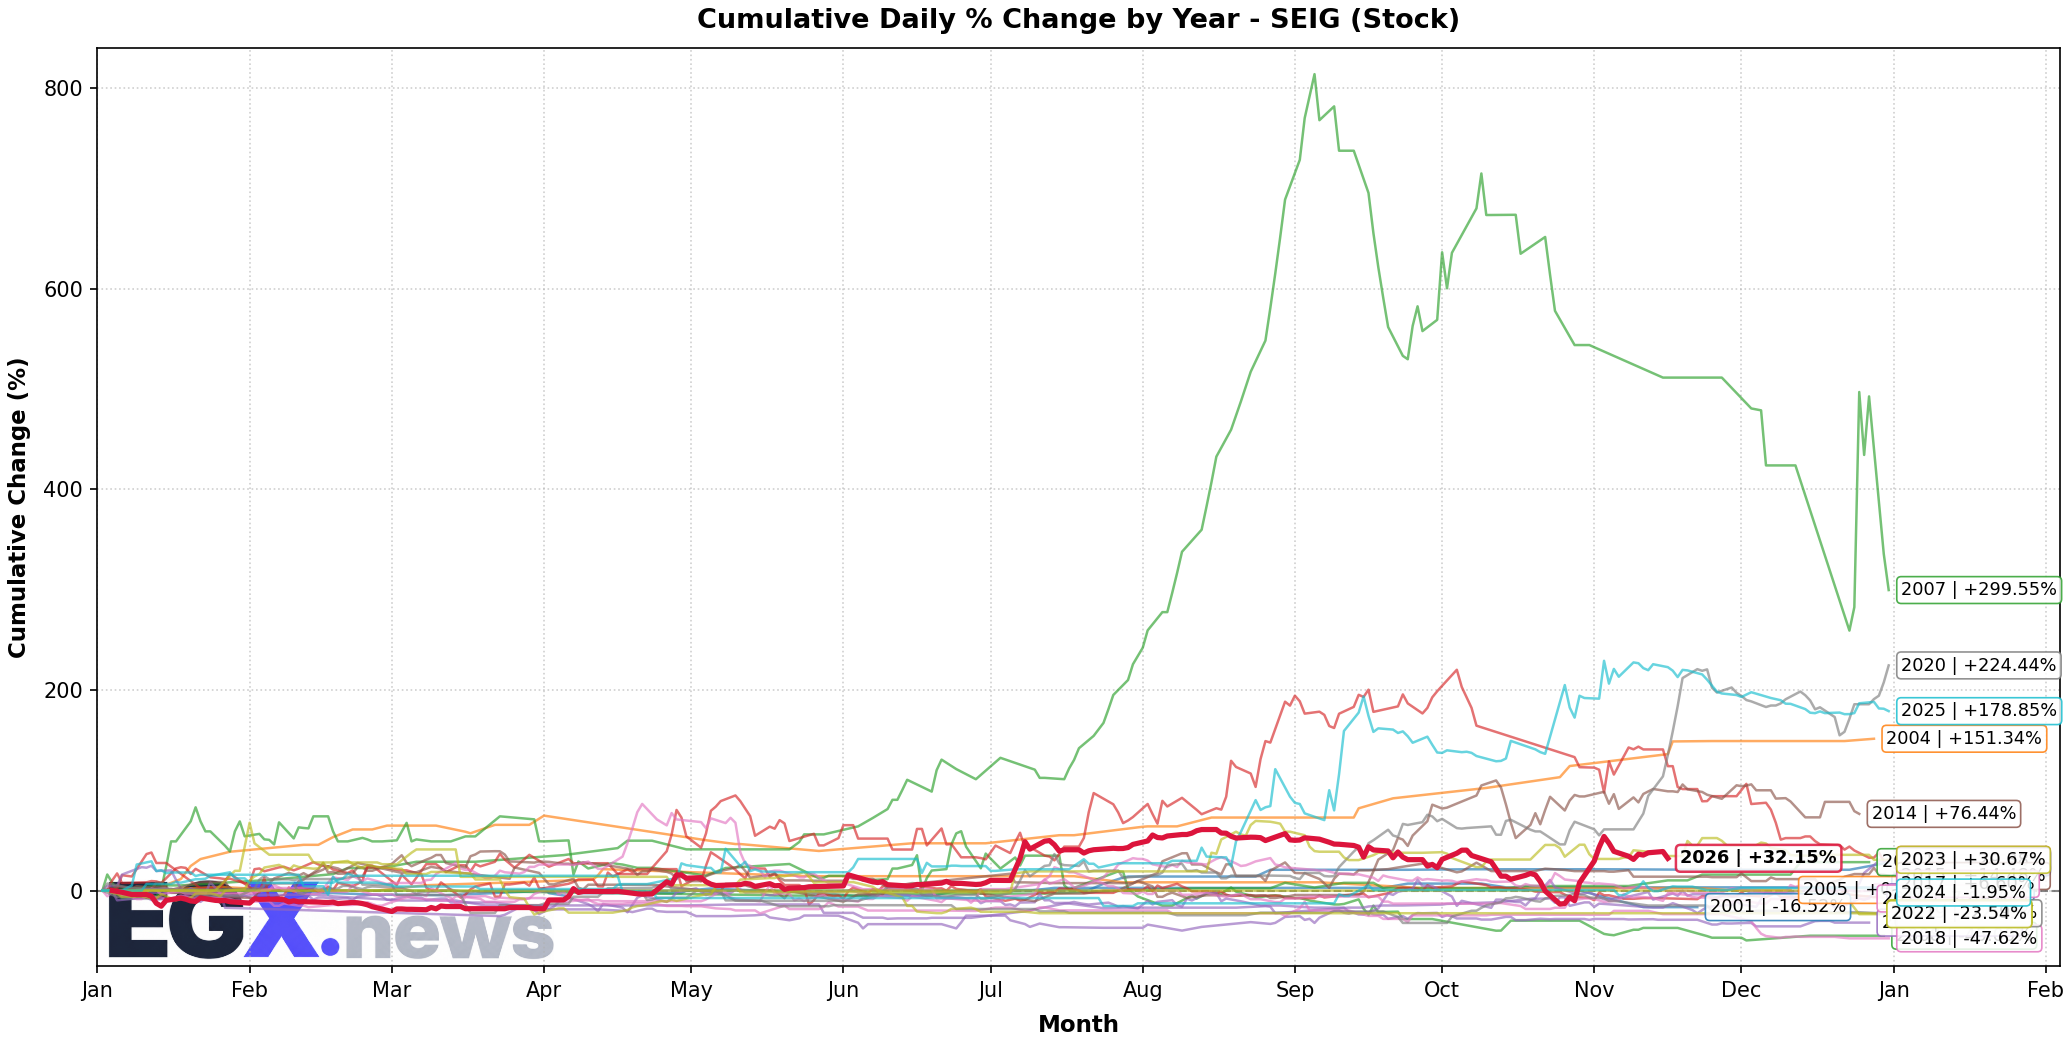
Seasonal Trend & Historical Patterns (SEIG)
Click to EnlargeHistorical monthly seasonal return distribution and performance cycles for SEIG.
Trend Structure & Moving Averages
Golden Cross (459D)Trend Score is 65/100 with price trading 8.0% above its 20-day SMA and above the 200-day long-term benchmark (SMA50 is above SMA200 for 459 sessions).
Momentum, Volume Flow & Volatility
RSI(14) is 52.41 (Bullish Momentum), moving -0.87 over the past 5 sessions — indicating positive momentum in buyer territory. MACD line (6.753) is above signal line (3.72) with a histogram of +3.034 (Bullish Momentum).
20-day annualized volatility is 136.85%, ATR(14) is 21.51 (9.41% of price), and price is trading in the middle channel (%B: 0.613, Bandwidth: 70.91%).
Statistical Backtests & Historical Win Rates
BacktestedEmpirical backtesting reveals that RSI oversold dips (<30) historically yield an average 20-day return of +3.72% with a 36.96% win rate (138 observations, Reliability: High), while volume spikes yield an average 20-day return of +6.32% (49.82% win rate).
Price sits 22.55% below All-Time High (295.0 set 73 sessions ago on 2026-08-03) and 22.55% below its 52-week high (295.0 on 2026-08-03).