


Souhag National Food Industries
SNFISouhag National Food Industries
Company Overview & Activities
Sohag National Company for Food Industries (known as: Sohag National) is a public company, listed on Egyptian Exchange (EGX) since January 1997. Sohag National operates within the food, beverage sector focusing on agricultural products. Sohag National is based in Sohag, Egypt and was established in June 1986.
EGS30301C013
Listed on EGX
FRA Certified Auditor
Financial FAQ & Technical Outlook for Souhag National Food Industries (SNFI)
Quantitative Technical Engine (SNFI)
Souhag National Food Industries holds a Bearish technical posture (Overall Score: 21.5/100) with Trend Score 20/100, Momentum Score 10/100 (RSI 38.67 - Bearish Momentum), and Volume Score 35/100 (distributing, 0.33x 20D baseline).
Support & Resistance Confluence Matrix
AlgorithmicNearest support is at 7.55 [Strength: 70.0/100, Tier 1 (Macro 500D)] (17.12% below price with a 100.0% confirmed bounce rate across 2 tests, Reliability: Low). Nearest resistance is at 9.4 [Strength: 82.2/100, Tier 1 (Macro 500D)] (3.18% above price with a 88.9% confirmed rejection rate across 9 tests, Reliability: Moderate).
Seasonal Trend & Historical Patterns (SNFI)
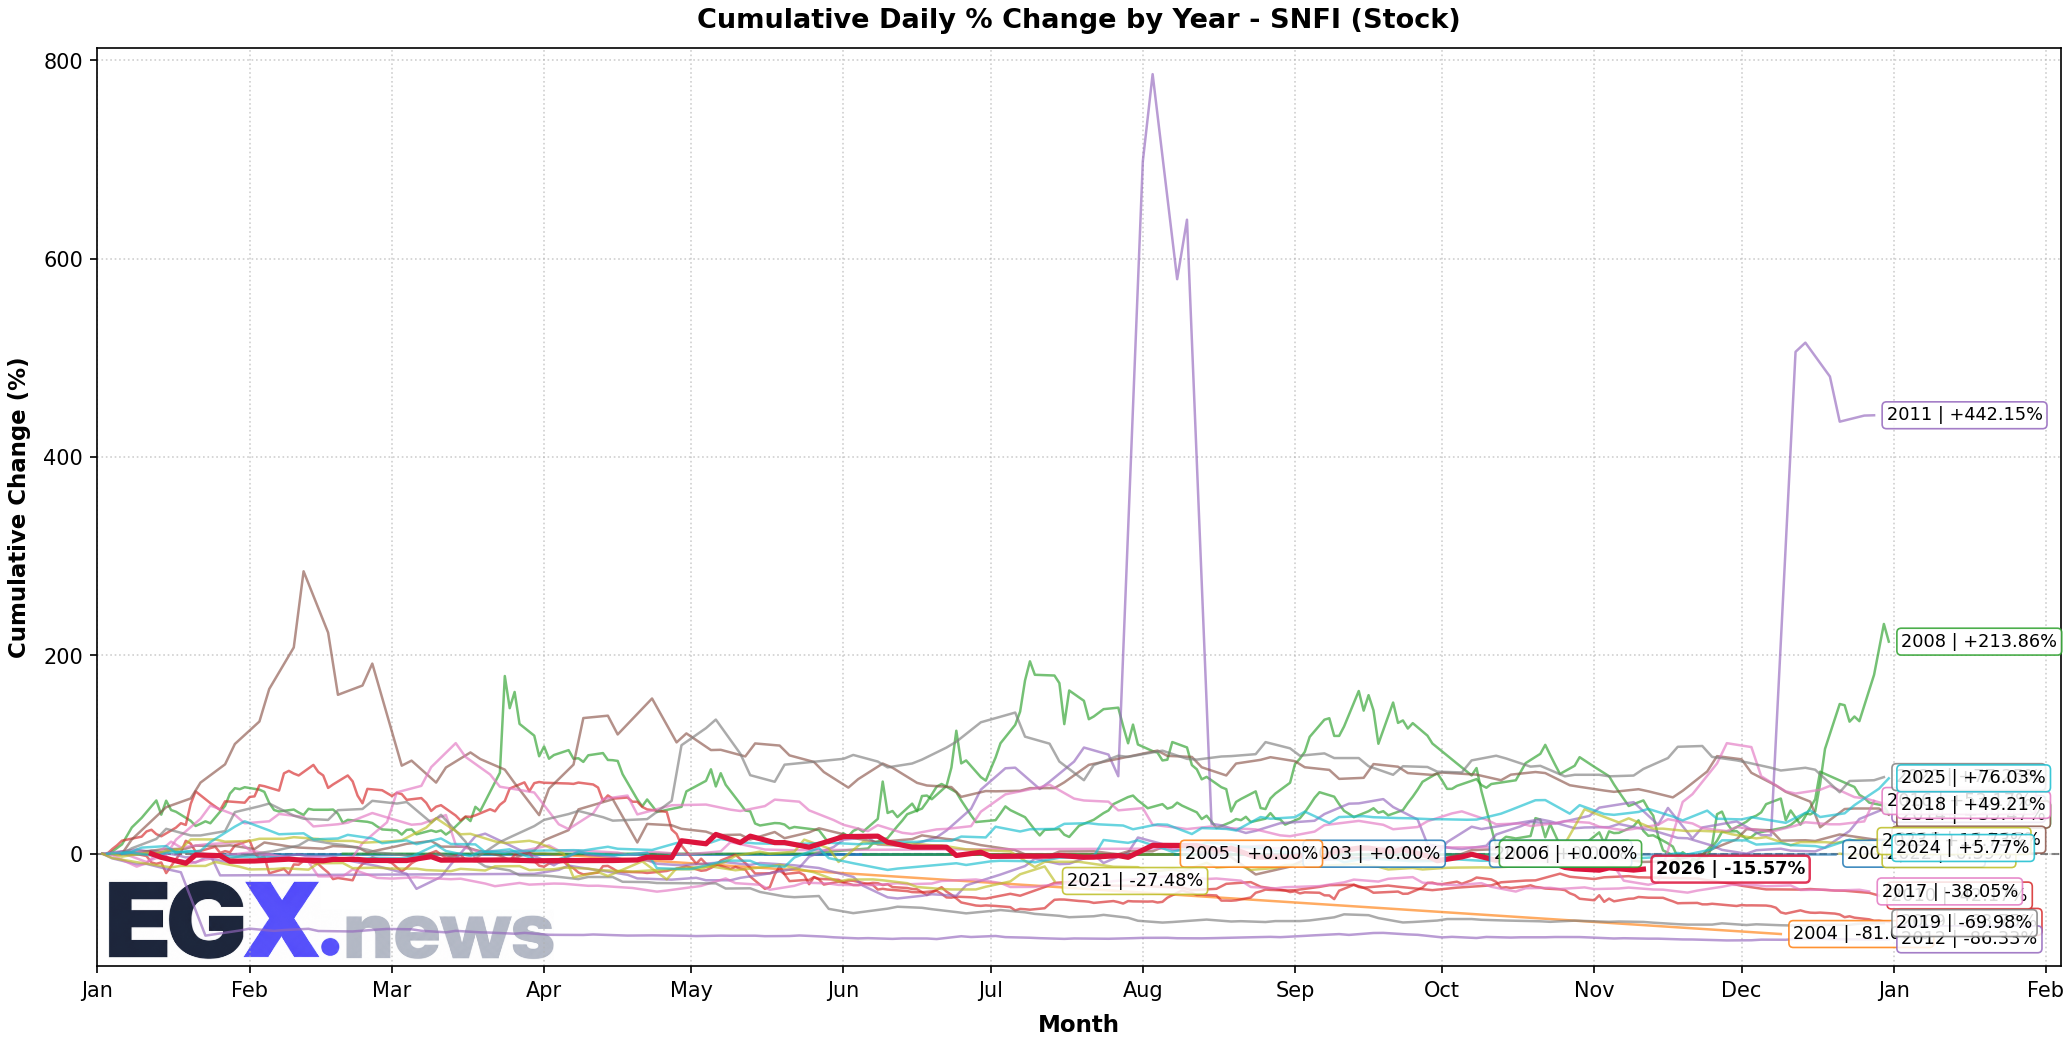
Click to EnlargeHistorical monthly seasonal return distribution and performance cycles for SNFI.
Trend Structure & Moving Averages
Golden Cross (294D)Trend Score is 20/100 with price trading 10.6% below its 20-day SMA and above the 200-day long-term benchmark (SMA50 is above SMA200 for 294 sessions).
Momentum, Volume Flow & Volatility
RSI(14) is 38.67 (Bearish Momentum), moving +0.43 over the past 5 sessions — reflecting persistent selling pressure. MACD line (-0.491) is below signal line (-0.357) with a histogram of -0.134 (Bearish Momentum).
20-day annualized volatility is 67.41%, ATR(14) is 0.73 (8.01% of price), and price is trading near the lower band (%B: 0.17, Bandwidth: 32.29%).
Statistical Backtests & Historical Win Rates
BacktestedEmpirical backtesting reveals that RSI oversold dips (<30) historically yield an average 20-day return of +8.55% with a 58.06% win rate (31 observations, Reliability: Moderate), while volume spikes yield an average 20-day return of +13.45% (50.86% win rate).
Price sits 70.07% below All-Time High (30.44 set 1315 sessions ago on 2011-08-01) and 29.92% below its 52-week high (13.0 on 2026-05-04).