


Sues Canal Co. for Technology Settling
SCTSSues Canal Co. for Technology Settling
Company Overview & Activities
1-انشاء و إدارة المناطق التكنولوجية و الحضانات و العملية و مراكز التدريب لاعداد الباحثين و نقل التكنولوجيا و تقديم الخدمات المرتبطة بذلك . 2-تصميم البرمجيات و انتاج المحتوى الالكترونى – تصميم البرمجيات ونظم التشغيل و النظم المدمجة و ادخال البيانات على الحسابات بالوسائل الالكترونية و انشاء البيانات و نظم المعلومات الالكترونية بصورة المختلفةمن صوت و صورة و بيانات. 3-انتاج برامج و أنظمة الحاسبات الاليه – تصميم و انتاج برامج و أنظمة الحاسبات الالية و تطبيقاتها بمختلف أنواعها و تشغيلها و التدريب عليها . 4-الإسكان الذى يؤجر و حداته بالكامل خالية لأغراض السكن غير الادارى بشرط الا يقل عدد الوحدات عن 50 وحدة سكنيه . 5-إقامة المستشفيات المتكاملة و ما تضمنه من أنشطة داخليه علاجية او خدمية الى غرض الشركة الدامجة و ذلك بشرط ان تقدم 10 % بالمجان سنويا من عدد الاسرة التي يتم شغلها بالنسبة للمستشفى خلال فترة الاعفاء الضريبى . 6-انشاء و إدارة جامعات و معاهد و مدارس و مؤسسات تعليمية و مؤسسات جامعية . 7-الاستثمار العقارى .
EGS740C1C010
2004-03-31
FRA Certified Auditor
Financial FAQ & Technical Outlook for Sues Canal Co. for Technology Settling (SCTS)
Quantitative Technical Engine (SCTS)
Sues Canal Co. for Technology Settling holds a Neutral technical posture (Overall Score: 55.8/100) with Trend Score 25/100, Momentum Score 80/100 (RSI 43.54 - Neutral), and Volume Score 70/100 (accumulating, 0.2x 20D baseline).
Support & Resistance Confluence Matrix
AlgorithmicNearest support is at 483.0 [Strength: 45.0/100, Tier 3 (Intraday 1-min)] (0.41% below price with a 100.0% confirmed bounce rate across 1 tests, Reliability: Low). Nearest resistance is at 489.0 [Strength: 45.0/100, Tier 3 (Intraday 1-min)] (0.82% above price with a 100.0% confirmed rejection rate across 1 tests, Reliability: Low).
Seasonal Trend & Historical Patterns (SCTS)
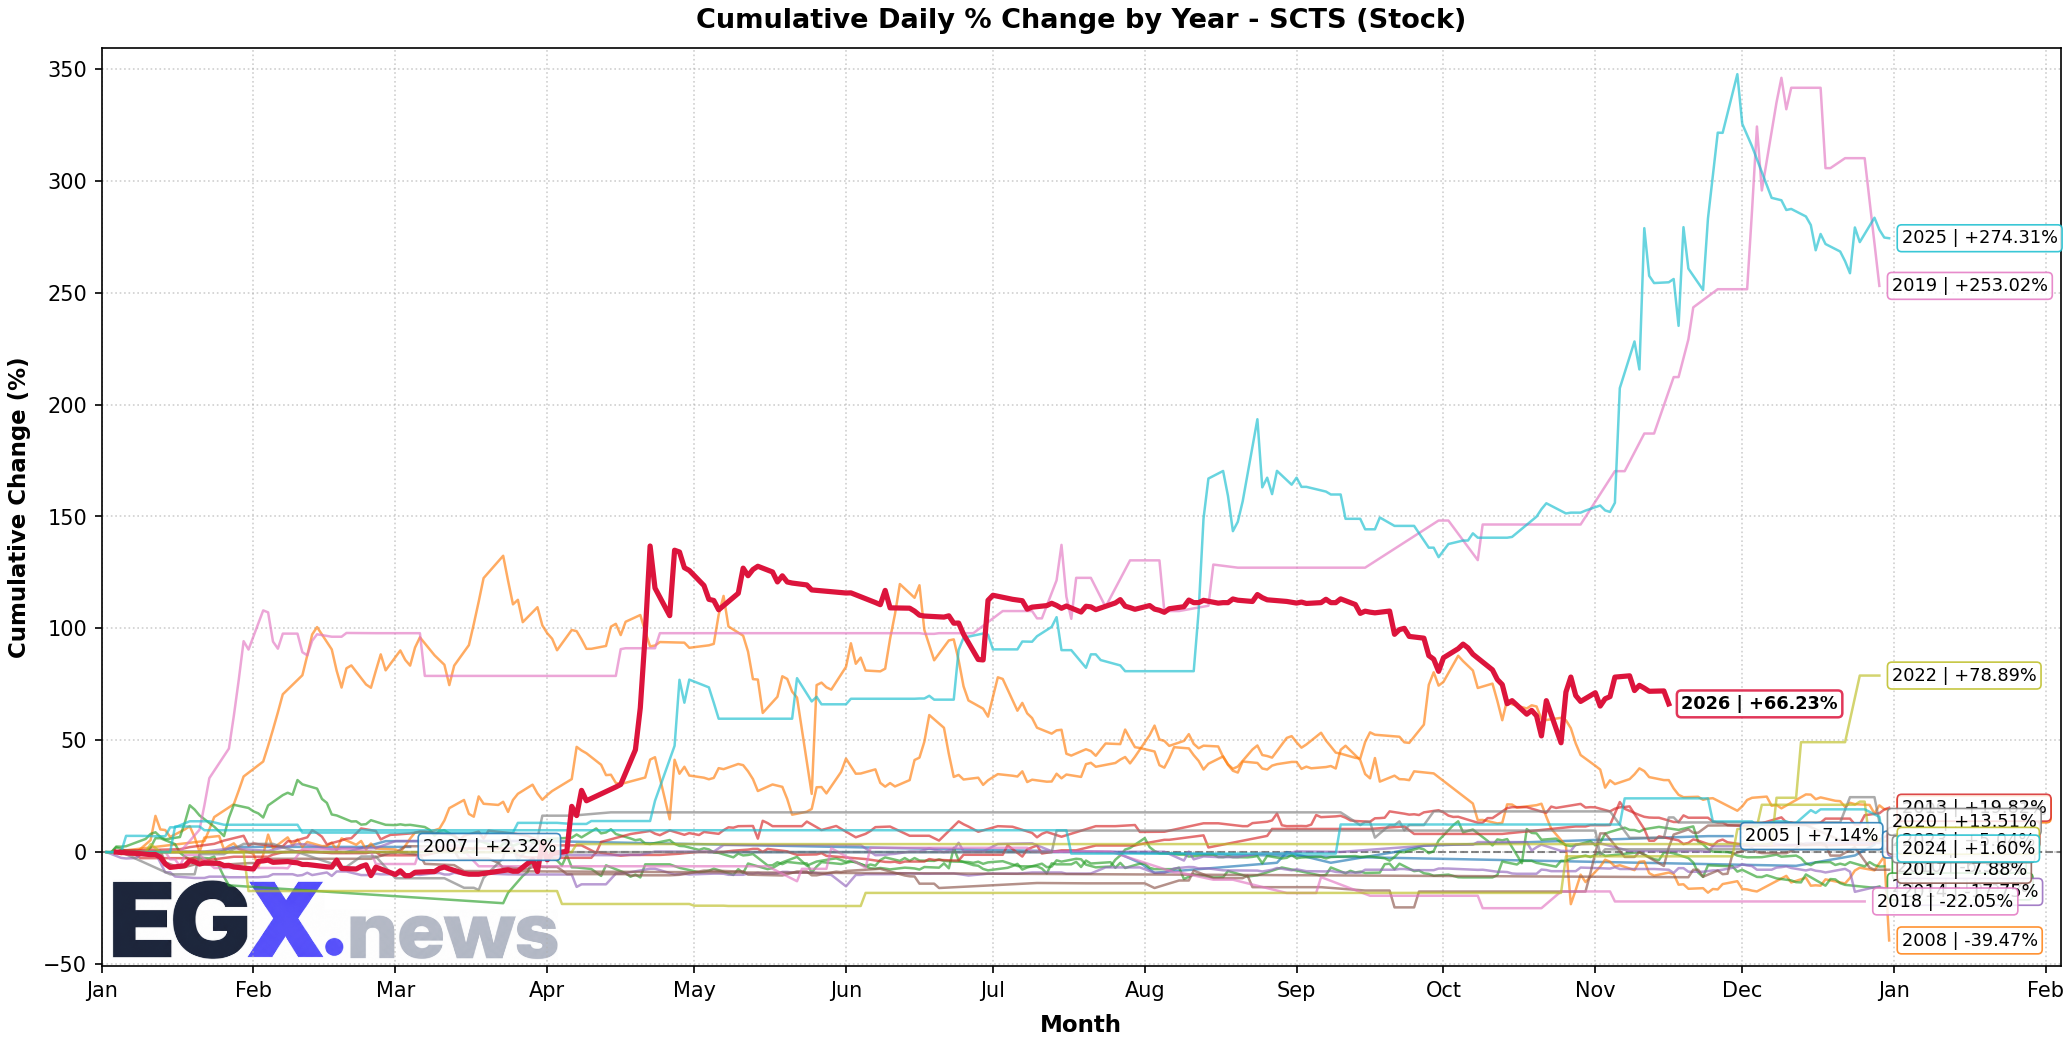
Click to EnlargeHistorical monthly seasonal return distribution and performance cycles for SCTS.
Trend Structure & Moving Averages
Golden Cross (483D)Trend Score is 25/100 with price trading 1.57% below its 20-day SMA and below the 200-day long-term benchmark (SMA50 is above SMA200 for 483 sessions).
Momentum, Volume Flow & Volatility
RSI(14) is 43.54 (Neutral), moving -4.42 over the past 5 sessions — indicating a balanced / consolidation posture. MACD line (-7.167) is above signal line (-10.062) with a histogram of +2.895 (Bullish Momentum).
20-day annualized volatility is 90.14%, ATR(14) is 30.1 (6.21% of price), and price is trading in the middle channel (%B: 0.414, Bandwidth: 18.37%).
Statistical Backtests & Historical Win Rates
BacktestedEmpirical backtesting reveals that RSI oversold dips (<30) historically yield an average 20-day return of +3.62% with a 42.03% win rate (69 observations, Reliability: Good), while volume spikes yield an average 20-day return of +4.65% (45.81% win rate).
Price sits 41.5% below All-Time High (829.02 set 133 sessions ago on 2026-04-23) and 41.5% below its 52-week high (829.02 on 2026-04-23).