


Suez Canal Bank
CANASuez Canal Bank SAE
Company Overview & Activities
بنك قناة السويس هو شركة مساهمة مصرية تأسس كبنك تجاري عام 1978. يبلغ رأس المال المصدر والمدفوع 6.5 مليار جنيه مصري، ويبلغ عدد الأسهم 650 مليون سهم. يقدم البنك خدمات مصرفية للشركات والأفراد، بالإضافة إلى خدمات الاستثمار والصيرفة الإسلامية، داخل جمهورية مصر العربية. كما يمتلك البنك 53 فرعًا ومكتب تمثيل في ليبيا، إلى جانب شبكة من المراسلين حول العالم. وقد تجاوز عدد الموظفين 1650 موظفًا.
EGS60231C015
1982-09-15
FRA Certified Auditor
Financial FAQ & Technical Outlook for Suez Canal Bank SAE (CANA)
Quantitative Technical Engine (CANA)
Suez Canal Bank holds a Bearish technical posture (Overall Score: 25.0/100) with Trend Score 10/100, Momentum Score 10/100 (RSI 30.73 - Bearish Momentum), and Volume Score 70/100 (accumulating, 1.11x 20D baseline).
Support & Resistance Confluence Matrix
AlgorithmicNearest support is at 32.09 [Strength: 45.0/100, Tier 3 (Intraday 1-min)] (1.23% below price with a 100.0% confirmed bounce rate across 1 tests, Reliability: Low). Nearest resistance is at 32.87 [Strength: 45.0/100, Tier 3 (Intraday 1-min)] (1.17% above price with a 100.0% confirmed rejection rate across 1 tests, Reliability: Low).
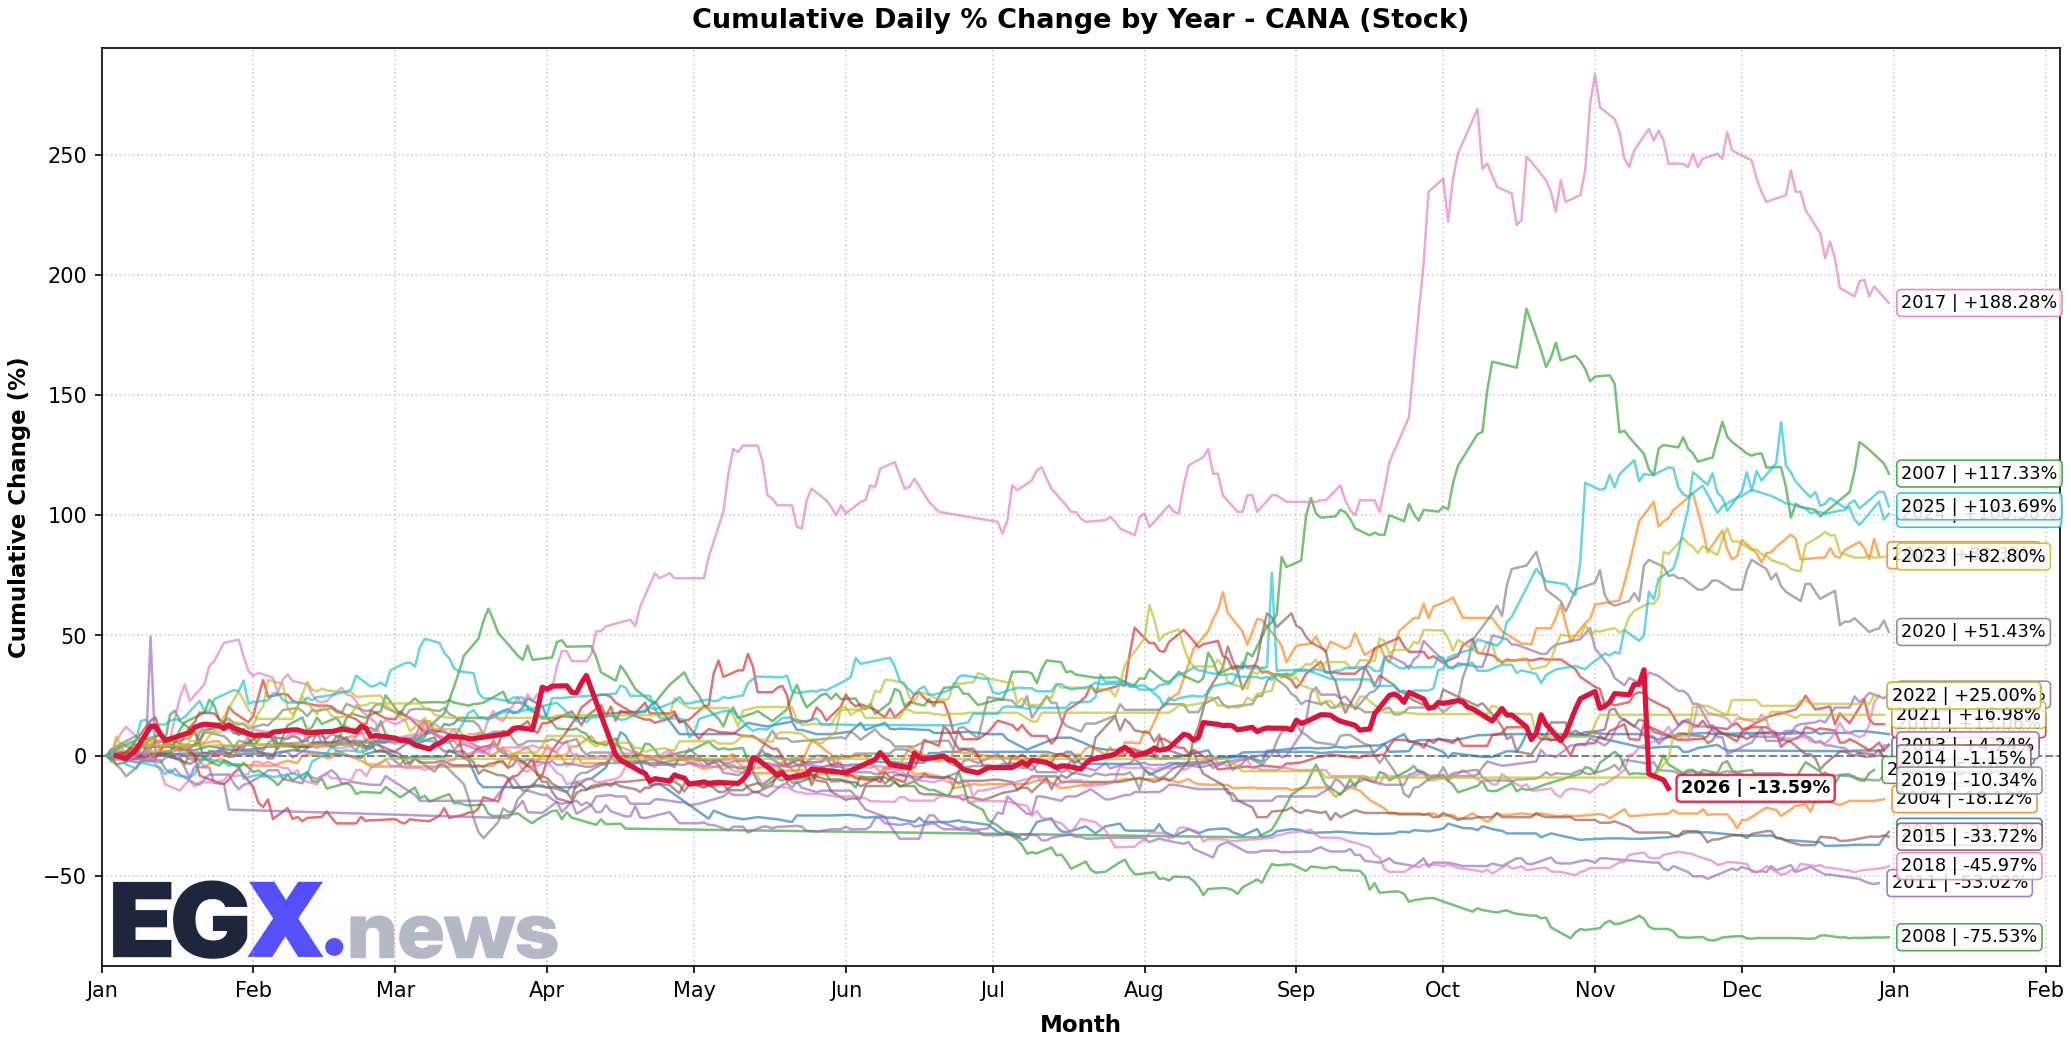
Seasonal Trend & Historical Patterns (CANA)
Click to EnlargeHistorical monthly seasonal return distribution and performance cycles for CANA.
Trend Structure & Moving Averages
Golden Cross (50D)Trend Score is 10/100 with price trading 25.36% below its 20-day SMA and below the 200-day long-term benchmark (SMA50 is above SMA200 for 50 sessions).
Momentum, Volume Flow & Volatility
RSI(14) is 30.73 (Bearish Momentum), moving -31.45 over the past 5 sessions — reflecting persistent selling pressure. MACD line (-1.422) is below signal line (0.047) with a histogram of -1.469 (Bearish Momentum).
20-day annualized volatility is 130.28%, ATR(14) is 3.09 (9.51% of price), and price is trading near the lower band (%B: -0.04, Bandwidth: 47.0%).
Statistical Backtests & Historical Win Rates
BacktestedEmpirical backtesting reveals that RSI oversold dips (<30) historically yield an average 20-day return of +0.61% with a 37.93% win rate (116 observations, Reliability: High), while volume spikes yield an average 20-day return of +3.13% (48.43% win rate).
Price sits 37.52% below All-Time High (52.0 set 40 sessions ago on 2026-09-20) and 37.52% below its 52-week high (52.0 on 2026-09-20).