


Taaleem Management Services
TALMTaaleem Management Services S.A.E
Company Overview & Activities
التجارة العامة فيما هو مسموح به قانونًا، واستغلال المنشآت والمؤسسات التعليمية والجامعية المختلفة في حدود القوانين والقرارات السارية في هذا الشأن. تملك وإدارة وتشغيل المنشآت والمؤسسات المختلفة في هذا الشأن. القيام بأعمال التخطيط والتسويق والدعم الفني والإداري للمنشآت، تدريب وتأهيل المؤسسات وإعداد المؤسسات والمنشآت المختلفة للاعتماد والحصول على شهادات الجودة من قبل الجهات المعنية والمحلية والدولية. إقامة وتشغيل مراكز لإعداد وتدريب وتأهيل الموارد البشرية. تقديم الخدمات التعليمية. تقديم الاستشارات القانونية والدراسات المتعلقة بالتقييم، وكذلك الاستشارات الاستثمارية فيما يتعلق بأسواق الأوراق المالية، وهذا الاستثمار لا يشمل التعاقد أو الاتجار في مجال الأوراق المالية طبقًا لنصوص المادة 27 من قانون سوق المال ولائحته التنفيذية، فيما عدا أيضًا الاستشارات الخاصة بمجال تكنولوجيا المعلومات. كما تشمل أنشطة الشركة التعاقد مع الجامعات العامة والخاصة، إدارة المشروعات التعليمية بما لا يخالف أحكام القانون رقم 162 لسنة 2018، ومع مراعاة أحكام القوانين واللوائح والقرارات السارية، ويشترط استمرار الترخيص لممارسة هذه الأنشطة. ويجوز للشركة أن تكون لها مصلحة أو تشترك بأي وجه من الوجوه مع الشركات وغيرها التي تزاول أعمالاً شبيهة بأعمالها أو التي قد تعاونها على تحقيق غرضها في مصر أو الخارج، كما يجوز لها أن تدمج في الهيئات الشبيهة أو تشتريها أو تلحقها بها وذلك طبقاً لأحكام القانون ولائحته التنفيذية."
EGS597R1C017
2021-03-23
FRA Certified Auditor
Financial FAQ & Technical Outlook for Taaleem Management Services S.A.E (TALM)
Quantitative Technical Engine (TALM)
Taaleem Management Services holds a Bullish technical posture (Overall Score: 72.0/100) with Trend Score 50/100, Momentum Score 90/100 (RSI 50.53 - Bullish Momentum), and Volume Score 70/100 (accumulating, 0.61x 20D baseline).
Support & Resistance Confluence Matrix
AlgorithmicNearest support is at 19.98 [Strength: 45.0/100, Tier 3 (Intraday 1-min)] (0.6% below price with a 100.0% confirmed bounce rate across 1 tests, Reliability: Low). Nearest resistance is at 20.41 [Strength: 45.0/100, Tier 3 (Intraday 1-min)] (1.54% above price with a 100.0% confirmed rejection rate across 1 tests, Reliability: Low).
Seasonal Trend & Historical Patterns (TALM)
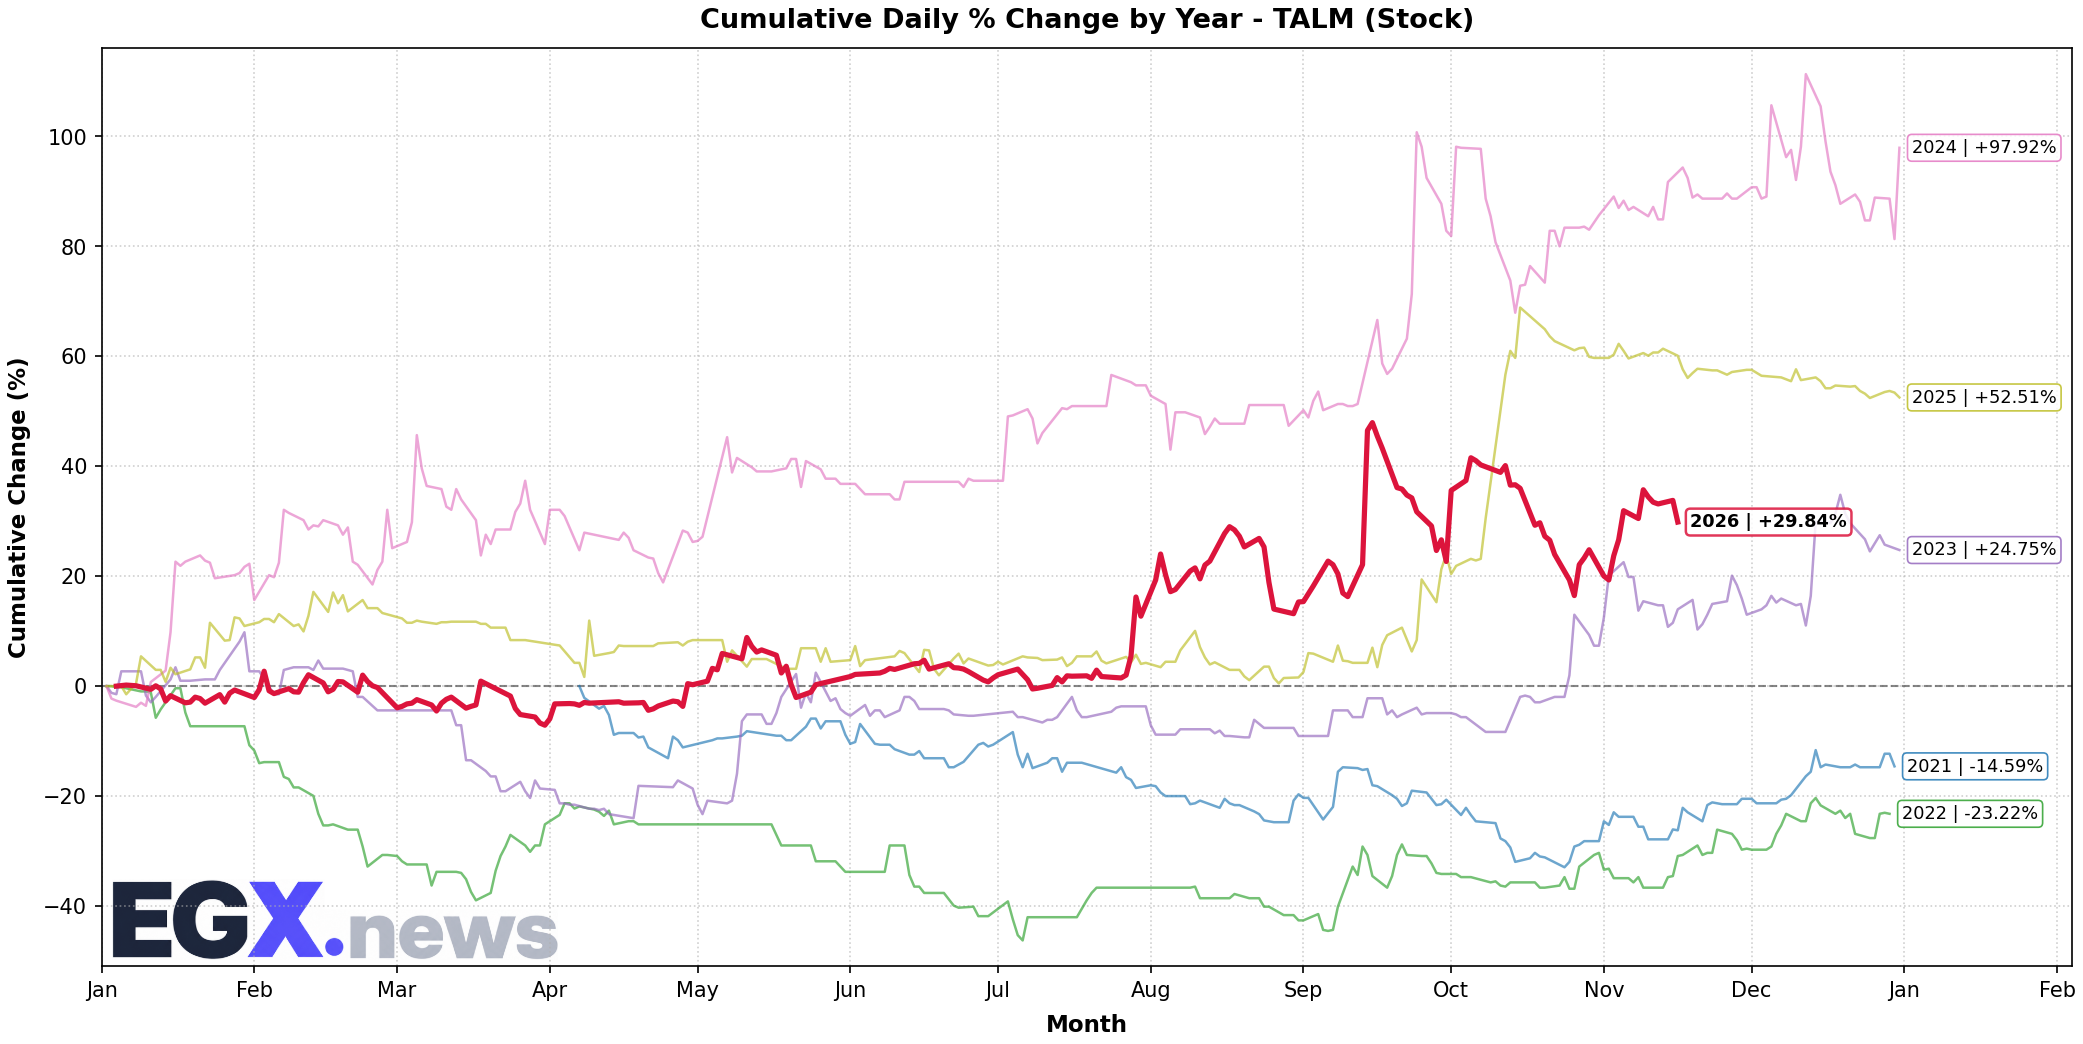
Click to EnlargeHistorical monthly seasonal return distribution and performance cycles for TALM.
Trend Structure & Moving Averages
Golden Cross (260D)Trend Score is 50/100 with price trading 2.39% above its 20-day SMA and above the 200-day long-term benchmark (SMA50 is above SMA200 for 260 sessions).
Momentum, Volume Flow & Volatility
RSI(14) is 50.53 (Bullish Momentum), moving -9.08 over the past 5 sessions — indicating positive momentum in buyer territory. MACD line (0.153) is above signal line (0.019) with a histogram of +0.134 (Bullish Momentum).
20-day annualized volatility is 41.96%, ATR(14) is 3.4 (16.92% of price), and price is trading in the middle channel (%B: 0.631, Bandwidth: 18.34%).
Statistical Backtests & Historical Win Rates
BacktestedEmpirical backtesting reveals that RSI oversold dips (<30) historically yield an average 20-day return of +1.20% with a 53.12% win rate (32 observations, Reliability: Moderate), while volume spikes yield an average 20-day return of +3.29% (58.95% win rate).
Price sits 21.79% below All-Time High (25.7 set 43 sessions ago on 2026-09-15) and 21.79% below its 52-week high (25.7 on 2026-09-15).