


Tanmiya for Real Estate Investment
TANMTanmiya for Real Estate Investment
Company Overview & Activities
التنمية العقارية للأراضي و المباني و المنشأت ، و تشمل شراء و بيع و تأجير و امتلاك الاراضى بهدف تقسيمها و تخطيطها و مدها بالمرافق و اعدادها للبناء او بيعها بحالتها او بعد إقامة المنشأت عليها . • تنمية المناطق اللوجستية و الصناعيه و المباني و الوحدات السكنيه و التجارية و الإدارية و الترفيهيه و الجراجات و مراكز خدمة و صيانة المركبات بغرض بيعها او تأجيرها او ادارتها و استغلالها . • انشاء المستودعات ( ثلاجات الحفظ و التبريد و التجميد ) و الأنشطة المرتبطة بها من مناولة و تخزين و تغليف و توزيع و نقل البضائع للنفس و للغير و لا يتم مزاولة نشاط النقل البري الا بعد القيد بسجل الناقلين و استخراج التراخيص اللازمة . • انشاء و إدارة القرى السياحية و الفنادق ( الثابته ) و الموتيلات و الأنشطة المكملة لها او المرتبطة بها من أنشطة خدمية و ترفيهيه و رياضية و تجارية و ثقافية . • إقامة المراكز التجارية و المولات و الهايبر ماركت . و ذلك دون الاخلال باحكام القوانين و اللوائح و القرارات السارية و بشرط استصدار التراخيص اللازمة لممارسة هذه الأنشطة ، و يجوز للشركة ان تشترك باى وجه من وجوه مع الشركات و غي
EGS21EB1C011
2021-06-16
FRA Certified Auditor
Financial FAQ & Technical Outlook for Tanmiya for Real Estate Investment (TANM)
Quantitative Technical Engine (TANM)
Tanmiya for Real Estate Investment holds a Bullish technical posture (Overall Score: 65.2/100) with Trend Score 65/100, Momentum Score 80/100 (RSI 48.81 - Neutral), and Volume Score 70/100 (accumulating, 0.72x 20D baseline).
Support & Resistance Confluence Matrix
AlgorithmicNearest support is at 5.74 [Strength: 45.0/100, Tier 3 (Intraday 1-min)] (0.52% below price with a 100.0% confirmed bounce rate across 1 tests, Reliability: Low). Nearest resistance is at 5.78 [Strength: 45.0/100, Tier 3 (Intraday 1-min)] (0.17% above price with a 100.0% confirmed rejection rate across 1 tests, Reliability: Low).
Seasonal Trend & Historical Patterns (TANM)
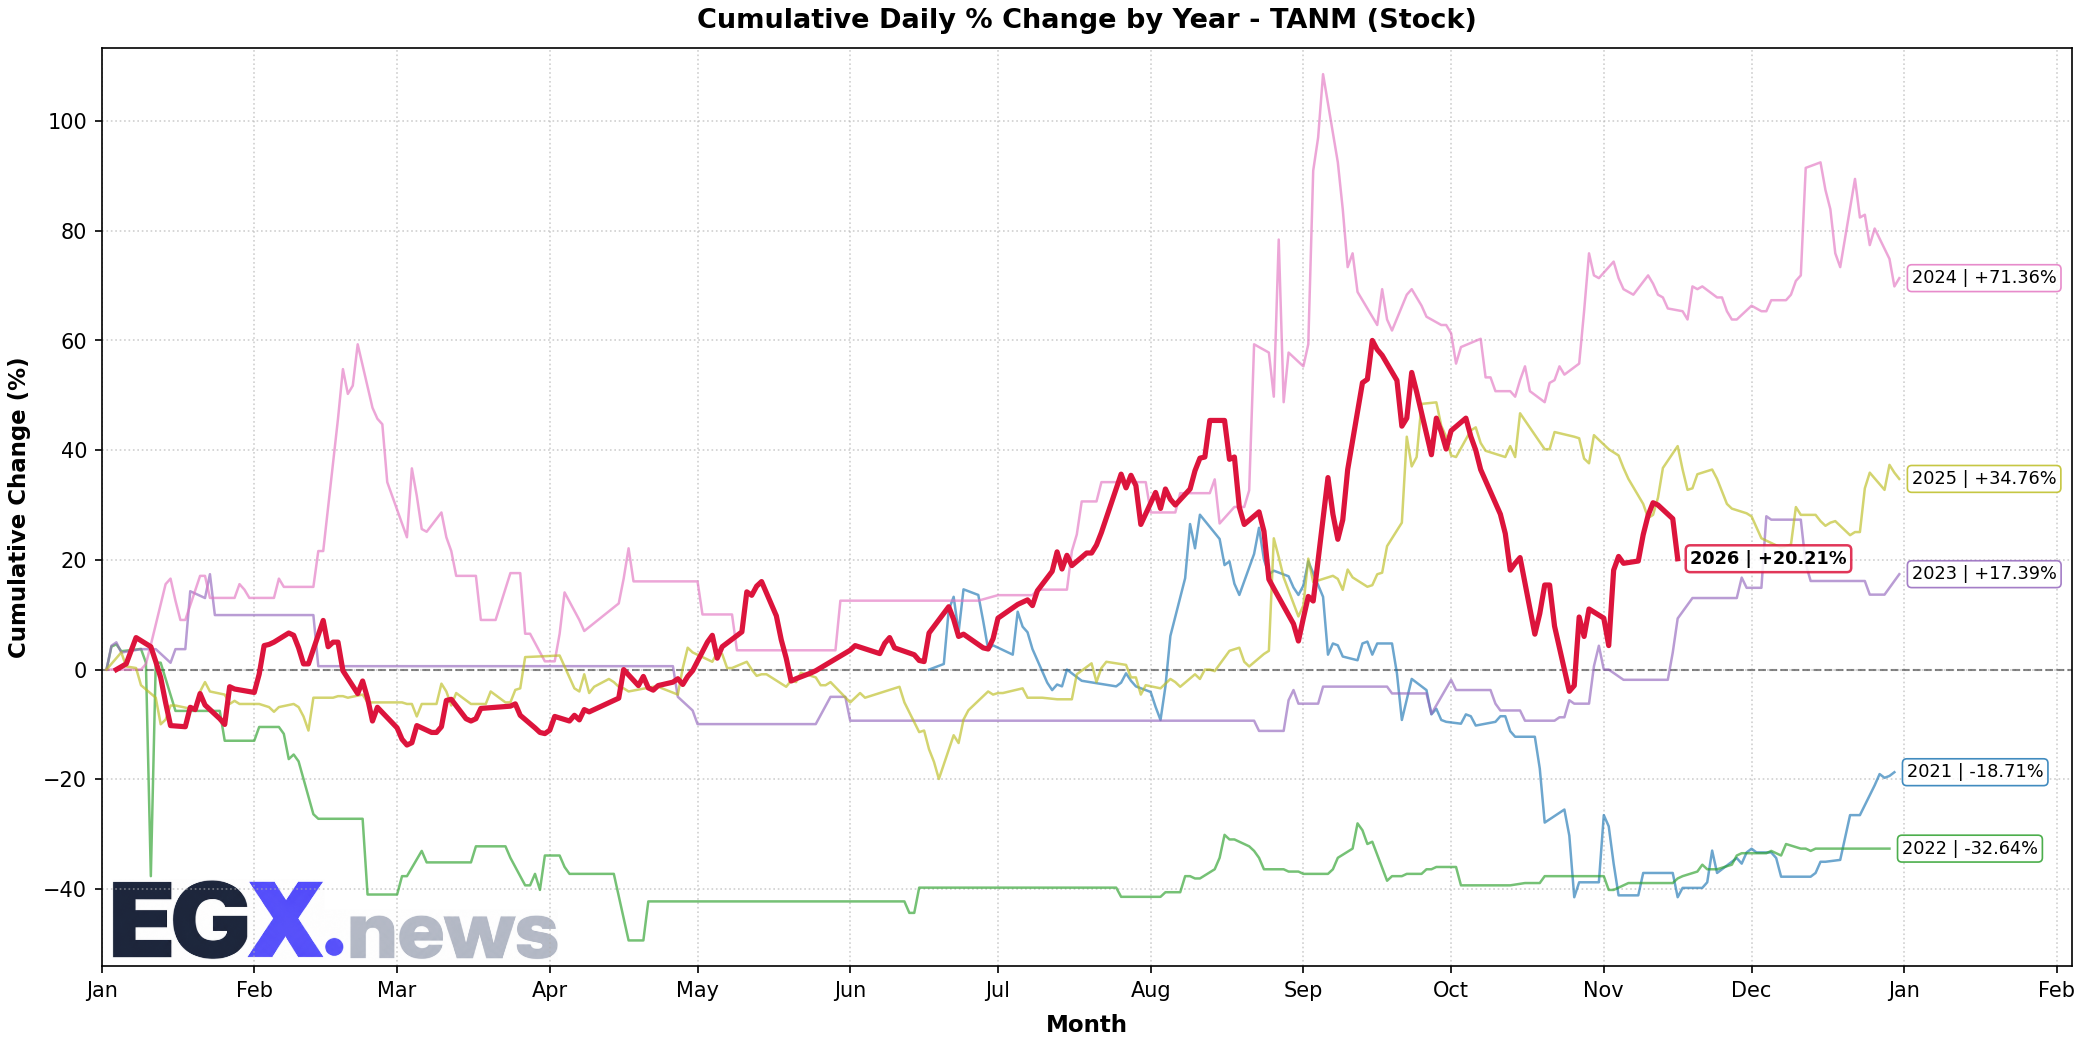
Click to EnlargeHistorical monthly seasonal return distribution and performance cycles for TANM.
Trend Structure & Moving Averages
Golden Cross (286D)Trend Score is 65/100 with price trading 3.96% above its 20-day SMA and above the 200-day long-term benchmark (SMA50 is above SMA200 for 286 sessions).
Momentum, Volume Flow & Volatility
RSI(14) is 48.81 (Neutral), moving -5.51 over the past 5 sessions — indicating a balanced / consolidation posture. MACD line (0.03) is above signal line (-0.077) with a histogram of +0.107 (Bullish Momentum).
20-day annualized volatility is 92.45%, ATR(14) is 0.41 (7.11% of price), and price is trading in the middle channel (%B: 0.614, Bandwidth: 35.5%).
Statistical Backtests & Historical Win Rates
BacktestedEmpirical backtesting reveals that RSI oversold dips (<30) historically yield an average 20-day return of +7.56% with a 80.0% win rate (15 observations, Reliability: Low), while volume spikes yield an average 20-day return of +2.53% (59.26% win rate).
Price sits 32.12% below All-Time High (8.5 set 43 sessions ago on 2026-09-15) and 32.12% below its 52-week high (8.5 on 2026-09-15).