


TAWASOA FOR FACTORING
TWSATAWASOA FOR FACTORING
Company Overview & Activities
تم تأسيس شركة توسع للتخصيم وبدأت عملياتها في عام 2020 لتكون أول مؤسسة مالية غير مصرفية تركز وتختص بمجال التخصيم في مصر. تأسست الشركة على يد مجموعة من رواد الأعمال ذوي خلفيات قوية ومتنوعة. نحن نقدم حلول تخصيم متميزة وسريعة ومصممة حسب الطلب، تعمل على تعزيز رأس المال العامل لعملائنا لدفع نمو أعمالهم
EGS7D231C010
2026-06-02
FRA Certified Auditor
Financial FAQ & Technical Outlook for TAWASOA FOR FACTORING (TWSA)
Quantitative Technical Engine (TWSA)
TAWASOA FOR FACTORING holds a Neutral technical posture (Overall Score: 47.8/100) with Trend Score 35/100, Momentum Score 80/100 (RSI 47.03 - Neutral), and Volume Score 35/100 (distributing, 0.43x 20D baseline).
Support & Resistance Confluence Matrix
AlgorithmicNearest support is at 6.51 [Strength: 45.0/100, Tier 3 (Intraday 1-min)] (1.06% below price with a 100.0% confirmed bounce rate across 1 tests, Reliability: Low). Nearest resistance is at 6.64 [Strength: 45.0/100, Tier 3 (Intraday 1-min)] (0.91% above price with a 100.0% confirmed rejection rate across 1 tests, Reliability: Low).
Seasonal Trend & Historical Patterns (TWSA)
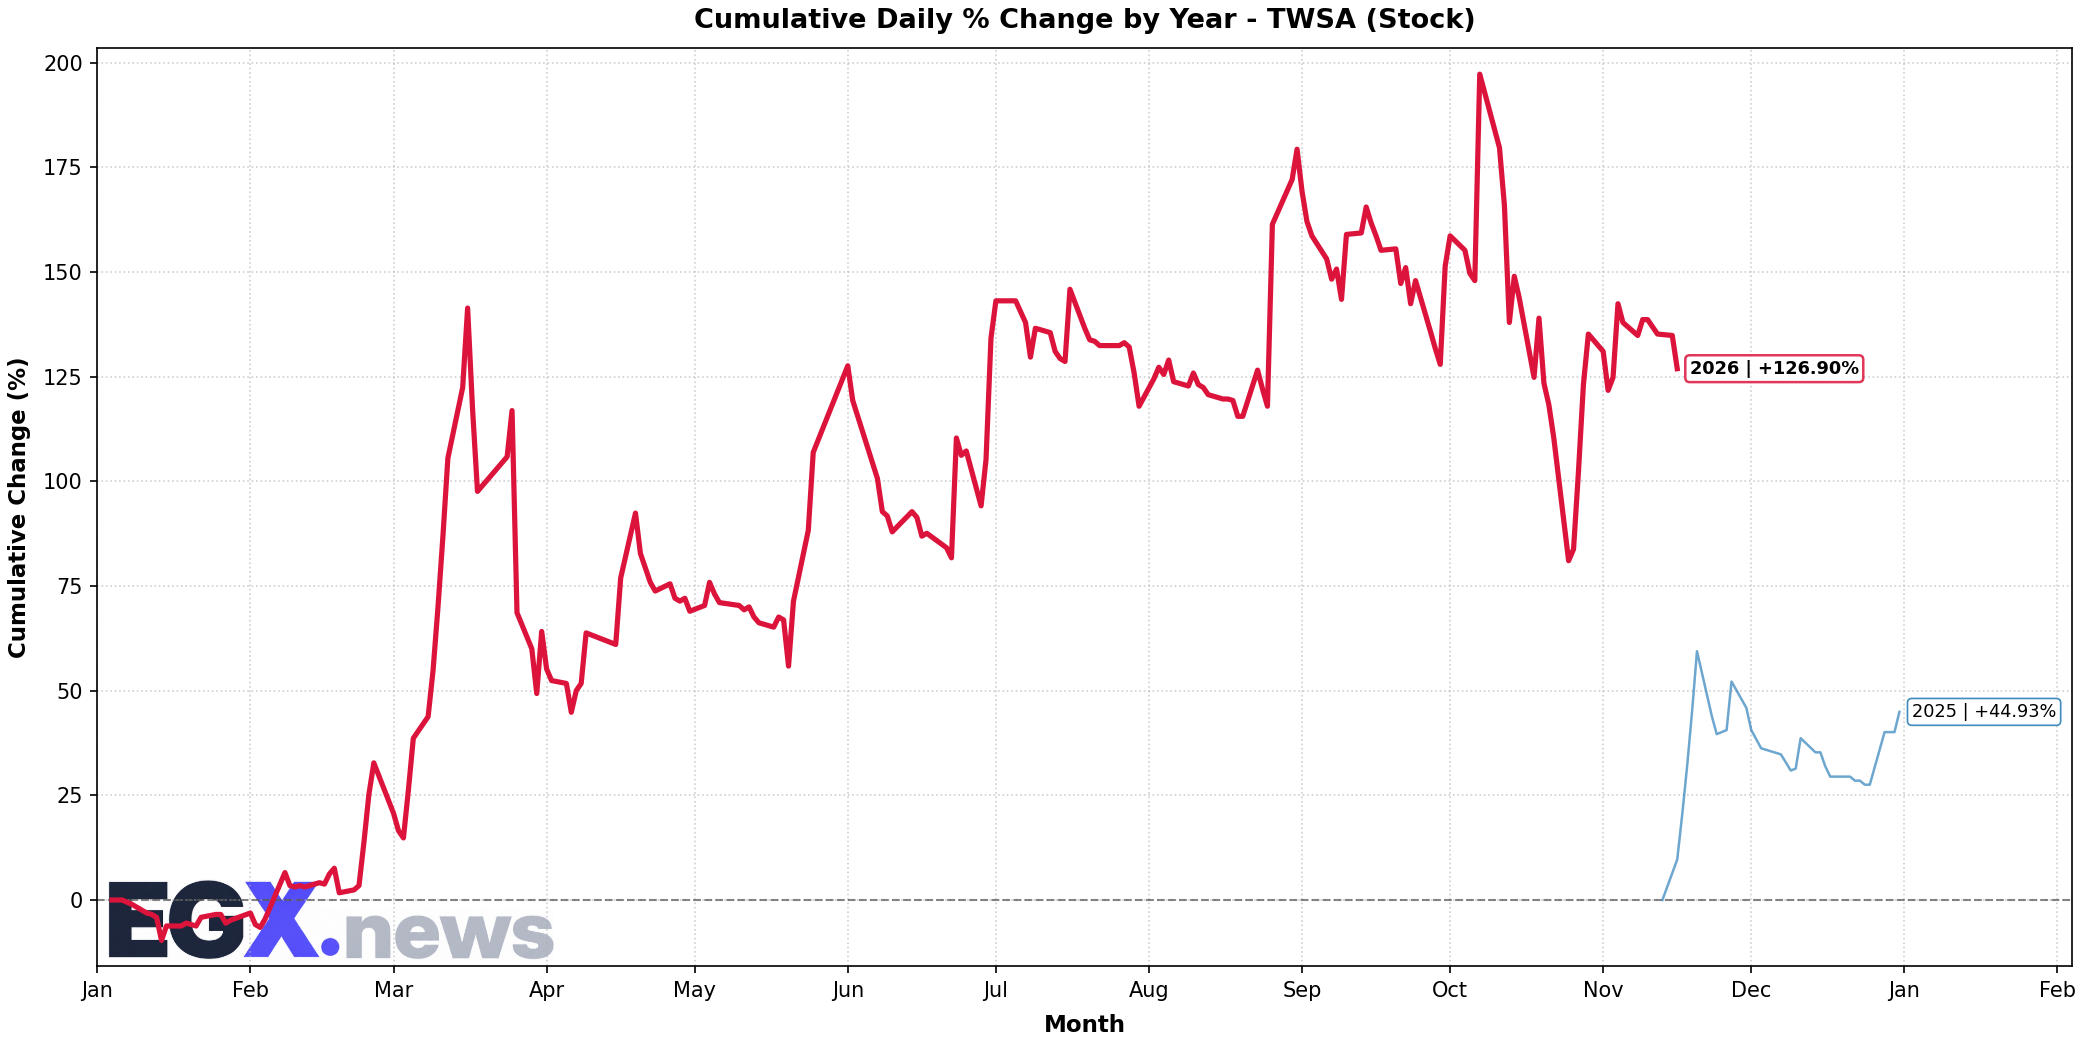
Click to EnlargeHistorical monthly seasonal return distribution and performance cycles for TWSA.
Trend Structure & Moving Averages
Golden Cross (262D)Trend Score is 35/100 with price trading 1.23% above its 20-day SMA and above the 200-day long-term benchmark (SMA50 is below SMA200).
Momentum, Volume Flow & Volatility
RSI(14) is 47.03 (Neutral), moving -5.27 over the past 5 sessions — indicating a balanced / consolidation posture. MACD line (-0.02) is above signal line (-0.061) with a histogram of +0.041 (Bullish Momentum).
20-day annualized volatility is 88.91%, ATR(14) is 0.51 (7.75% of price), and price is trading in the middle channel (%B: 0.542, Bandwidth: 31.23%).
Statistical Backtests & Historical Win Rates
BacktestedEmpirical backtesting reveals that RSI oversold dips (<30) historically yield an average 20-day return of +0.00% with a 0% win rate (0 observations, Reliability: Low), while volume spikes yield an average 20-day return of +7.68% (53.85% win rate).
Price sits 35.11% below All-Time High (10.14 set 26 sessions ago on 2026-10-11) and 35.11% below its 52-week high (10.14 on 2026-10-11).