


U Consumer Finance
VALUU Consumer Finance S.A.E
Company Overview & Activities
فاليو هي الشركة الرائدة في مجال التكنولوجيا المالية الشاملة، حيث تقدم مجموعة متكاملة من الخدمات المالية المبتكرة المصممة لتلبية احتياجات الأفراد والشركات. منذ انطلاقها في عام 2017، تواصل فاليو تقديم حلول مالية شاملة ومريحة تركز على العميل، مما يمكّن المستخدمين من إدارة احتياجاتهم وتطلعاتهم المالية بسهولة ويسر، وتمارس نشاط التمويل الاستهلاكي في ظل أحكام القانون رقم 18 لسنة 2020 تحت رقابة الهيئة العامة للرقابة المالية.
EGS505Z1C018
2025-05-21
FRA Certified Auditor
Financial FAQ & Technical Outlook for U Consumer Finance S.A.E (VALU)
Quantitative Technical Engine (VALU)
U Consumer Finance holds a Neutral technical posture (Overall Score: 40.0/100) with Trend Score 0/100, Momentum Score 80/100 (RSI 43.08 - Neutral), and Volume Score 35/100 (distributing, 0.93x 20D baseline).
Support & Resistance Confluence Matrix
AlgorithmicNearest support is at 9.55 [Strength: 45.0/100, Tier 3 (Intraday 1-min)] (0.52% below price with a 100.0% confirmed bounce rate across 1 tests, Reliability: Low). Nearest resistance is at 9.73 [Strength: 45.0/100, Tier 3 (Intraday 1-min)] (1.35% above price with a 100.0% confirmed rejection rate across 1 tests, Reliability: Low).
Seasonal Trend & Historical Patterns (VALU)
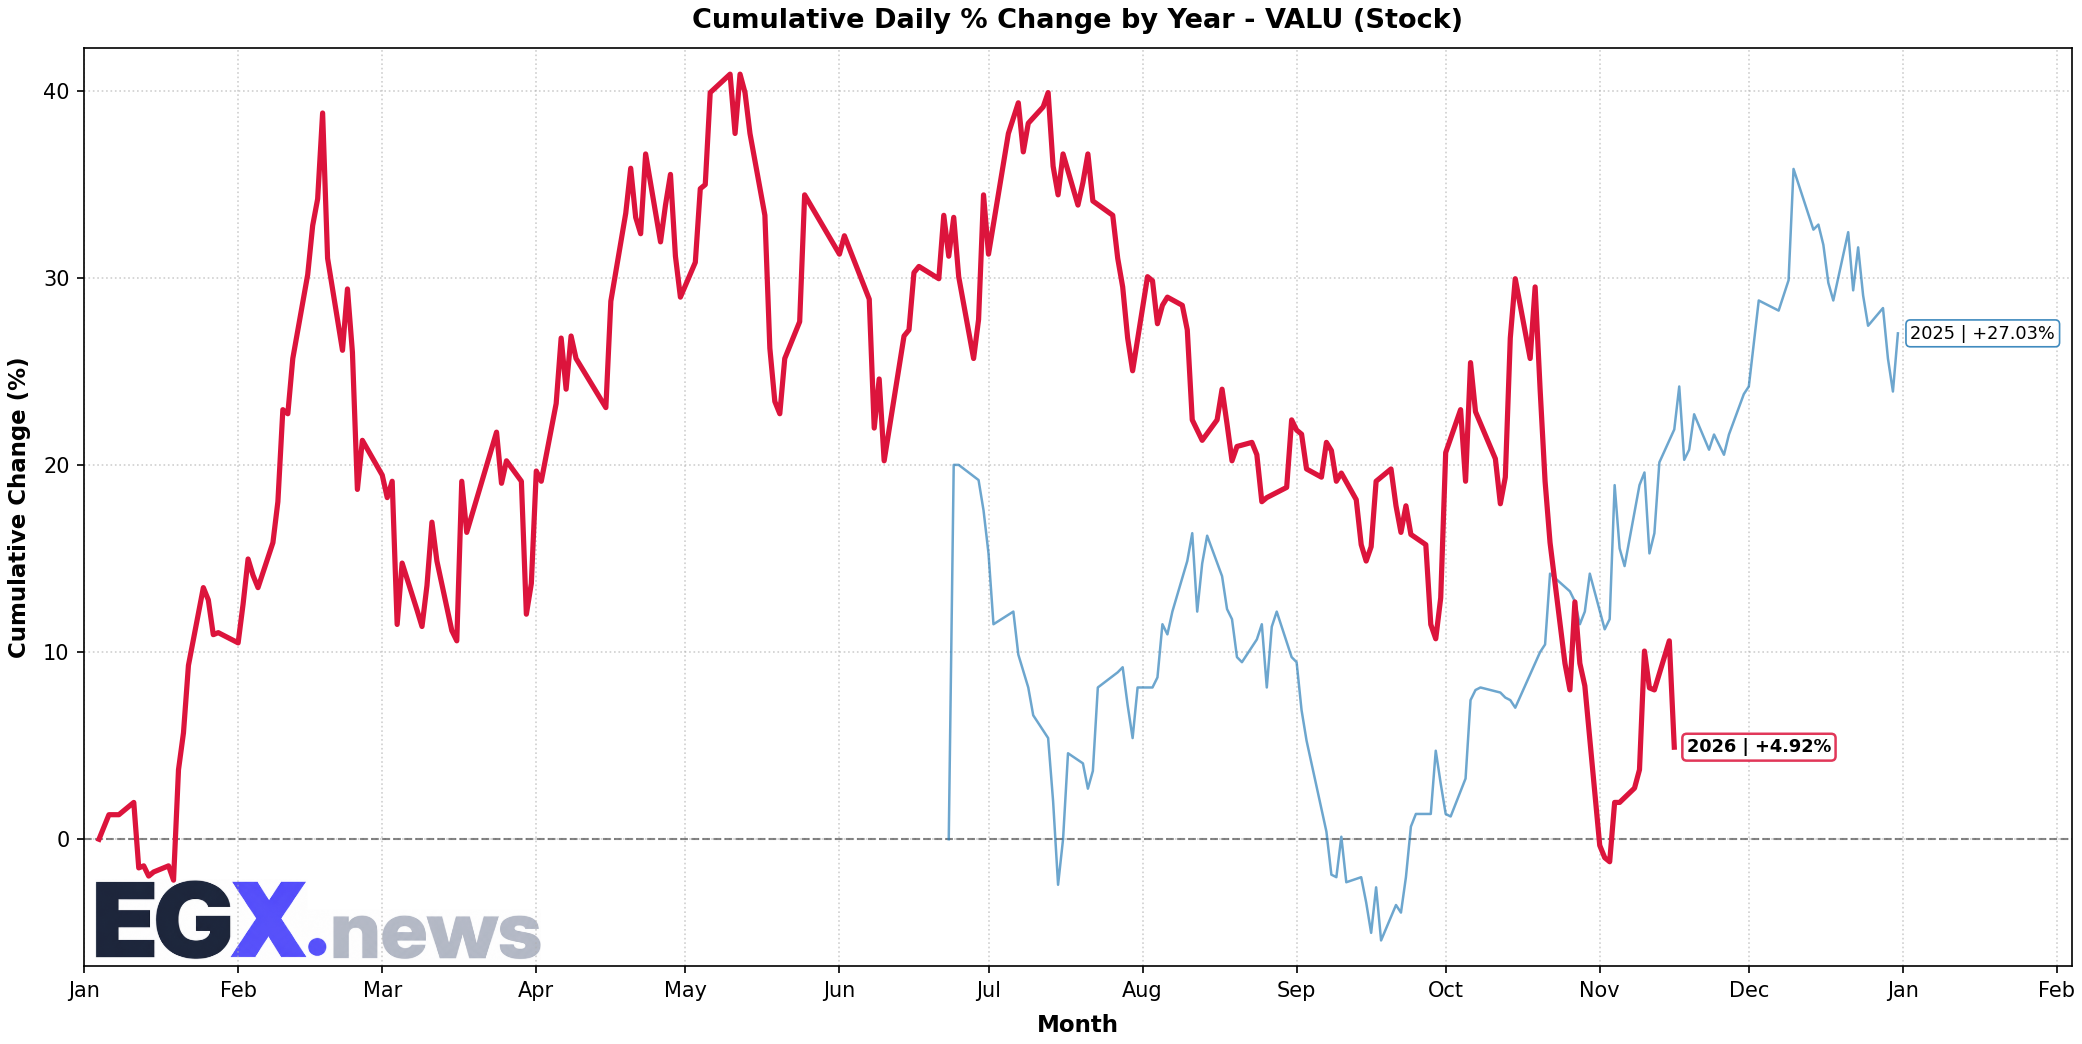
Click to EnlargeHistorical monthly seasonal return distribution and performance cycles for VALU.
Trend Structure & Moving Averages
Trend Score is 0/100 with price trading 2.64% below its 20-day SMA and below the 200-day long-term benchmark (SMA50 is below SMA200).
Momentum, Volume Flow & Volatility
RSI(14) is 43.08 (Neutral), moving +3.47 over the past 5 sessions — indicating a balanced / consolidation posture. MACD line (-0.262) is above signal line (-0.325) with a histogram of +0.063 (Bullish Momentum).
20-day annualized volatility is 55.23%, ATR(14) is 0.46 (4.79% of price), and price is trading in the middle channel (%B: 0.391, Bandwidth: 24.65%).
Statistical Backtests & Historical Win Rates
BacktestedEmpirical backtesting reveals that RSI oversold dips (<30) historically yield an average 20-day return of +0.00% with a 0% win rate (0 observations, Reliability: Low), while volume spikes yield an average 20-day return of +2.26% (60.87% win rate).
Price sits 27.22% below All-Time High (13.19 set 123 sessions ago on 2026-05-10) and 27.22% below its 52-week high (13.19 on 2026-05-10).