


Union
UPMSUnion Pharmacist Company For Medical Services And Investment
Company Overview & Activities
1-التصنيع والتصنيع لدى الغير والتوزيع والتسويق فى جميع مجالات الادوية والمستحضرات والمستلزمات الطبية ومستحضرات التجميل والمواد الكيمائية وأغذية الاطفال . 2-تصنيع المنتجات الورقية بكافة انواعها . 3-اقامة وادارة وانشاء الصيدليات بمستلزماتها بجميع انحاء الجمهورية . 4-اقامة وتشييد القاعات لاقامة المؤتمرات والندوات والحفالات بكافة اغراضها . 5-العمل فى مجال شراء الاراضى بغرض مدها بالمرافق وتجهيزها للبناء وتقسيم تلك الاراضى وبيعها او تاجيرها . 6-العمل فى مجالات المقاولات والانشاءات المتكاملة والاعمال المكملة لها . 7-تخطيط وتقسيم الاراضى واعدادها للبناء وفقا لاساليب البناء الحديثة . 8-بناء العقارات بأنواعها المختلفة وبيعها وتأجيرها . 9-تعمير واستصلاح الاراضى فى المجتمعات العمرانية الجديدة وغيرها مع مراعاه قرار رئيس مجلس الوزراء رقم 350 لسنة 2007 . 10-العمل فى مجال التنمية السياحية وفى كافة مجالات المنشأت السياحية من بناء فنادق ثابتة وهوتيلات وقرى سياحية وادارتها وتأجيرها او بيعها او ستغلالها طبقا للقوانين واللوائح السارية . 11-إنشاء وادارة وبيع وتأجير المشروعات السكنية
EGS3I1D1C015
Listed on EGX
FRA Certified Auditor
Financial FAQ & Technical Outlook for Union Pharmacist Company For Medical Services And Investment (UPMS)
Quantitative Technical Engine (UPMS)
Union holds a Neutral technical posture (Overall Score: 46.0/100) with Trend Score 10/100, Momentum Score 50/100 (RSI 37.84 - Bearish Momentum), and Volume Score 70/100 (accumulating, 0.28x 20D baseline).
Support & Resistance Confluence Matrix
AlgorithmicNearest support is at 9.5 [Strength: 65.0/100, Tier 3 (Intraday 1-min)] (0.21% below price with a 100.0% confirmed bounce rate across 15 tests, Reliability: High). Nearest resistance is at 9.7 [Strength: 81.4/100, Tier 1 (Macro 500D)] (1.89% above price with a 85.7% confirmed rejection rate across 42 tests, Reliability: High).
Seasonal Trend & Historical Patterns (UPMS)
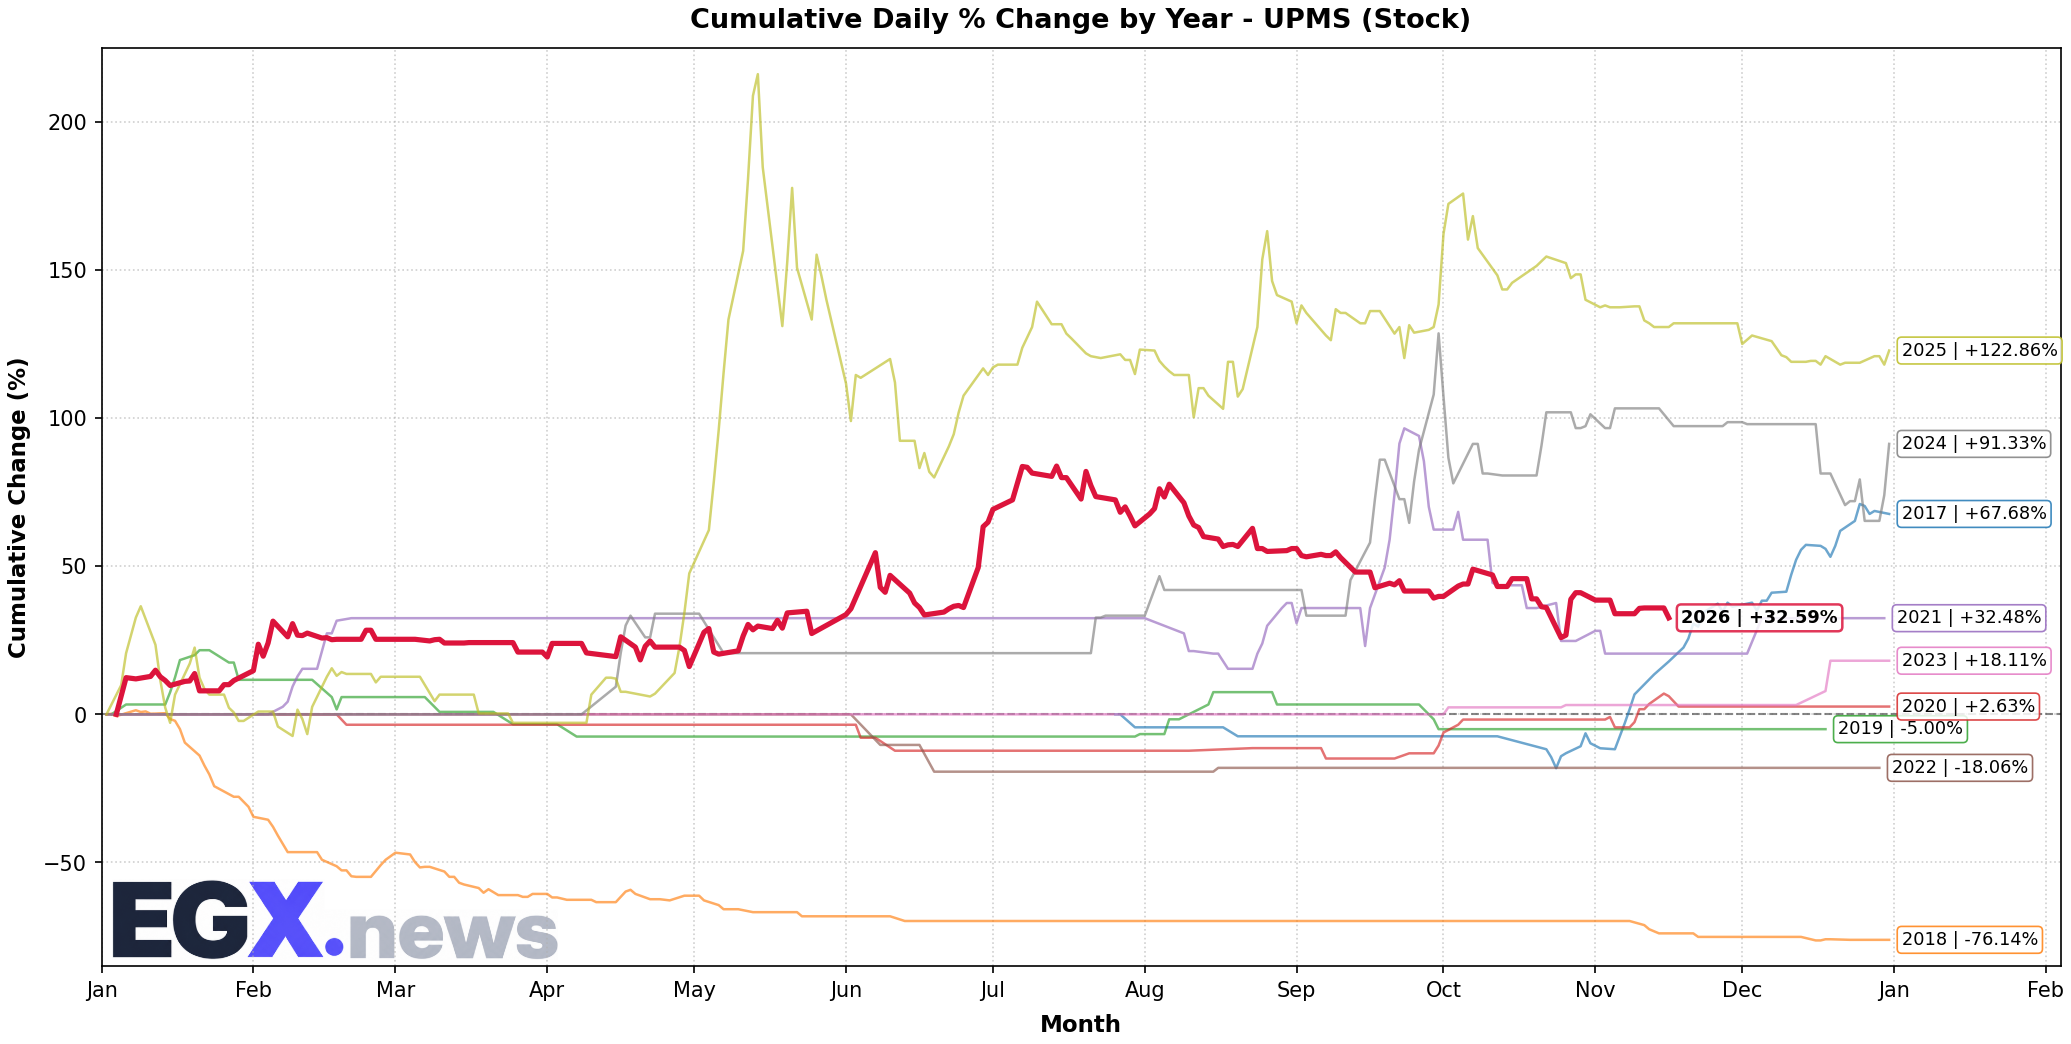
Click to EnlargeHistorical monthly seasonal return distribution and performance cycles for UPMS.
Trend Structure & Moving Averages
Golden Cross (689D)Trend Score is 10/100 with price trading 2.46% below its 20-day SMA and below the 200-day long-term benchmark (SMA50 is above SMA200 for 689 sessions).
Momentum, Volume Flow & Volatility
RSI(14) is 37.84 (Bearish Momentum), moving -1.87 over the past 5 sessions — reflecting persistent selling pressure. MACD line (-0.152) is above signal line (-0.161) with a histogram of +0.009 (Bullish Momentum).
20-day annualized volatility is 48.21%, ATR(14) is 0.46 (4.83% of price), and price is trading in the middle channel (%B: 0.296, Bandwidth: 11.78%).
Statistical Backtests & Historical Win Rates
BacktestedEmpirical backtesting reveals that RSI oversold dips (<30) historically yield an average 20-day return of -0.95% with a 26.67% win rate (105 observations, Reliability: High), while volume spikes yield an average 20-day return of +6.50% (48.21% win rate).
Price sits 30.05% below All-Time High (13.61 set 91 sessions ago on 2026-07-07) and 30.05% below its 52-week high (13.61 on 2026-07-07).