


Utopia Real Estate Investment & Tourism
UTOPUtopia Real Estate Investment & Tourism SAE
Company Overview & Activities
شركة يوتوبيا هى شركة مساهمة مصرية للإستثمار العقارى والسياحى وقد أنشأت وفقاً لأحكام القانون رقم 159 لسنة 1981 وقد بدأت الشركة مشوارها منذ عام 1986 تأسست شركة يوتوبيا للإستثمار العقارى والسياحى عام 1999 شركة مساهمة مصرية أحدى شركات مجموعة زين جروب . وأن شركة يوتوبيا خلال السنوات العشرون الماضية وضعت نفسها على أنها واحدة من الشركات الرائدة فى التطوير العقارى فى مصر قوية مع التاريخ والرؤية المستقبلية والتخطيط للمستقبل وتحول الخيال الى واقع ملموس وأصبحت شركة يوتوبيا من أبرز الشركات فى الميدان العقارى إلتزاماً وكفاءة . وأن شركة يوتوبيا موثوق بها من كافة عملائها لإلتزامها دائماً بتعهداتها والتطوير العقارى المبتكر وبالتصماميم الهندسية المبتكرة لتحقيق الإلتزام والمثابرة . وهدفنا دائماً هو تعزيز مفاتيح النجاح والنمو السريع للتنمية وللمساهمة فى تنفيذ خطة الدولة وأن نقدم لعملائنا قيمة ما يستحق حقاً وفى أفضل صورة .
EGS655Y1C017
Listed on EGX
FRA Certified Auditor
Financial FAQ & Technical Outlook for Utopia Real Estate Investment & Tourism SAE (UTOP)
Quantitative Technical Engine (UTOP)
Utopia Real Estate Investment & Tourism holds a Bearish technical posture (Overall Score: 39.2/100) with Trend Score 25/100, Momentum Score 80/100 (RSI 42.94 - Neutral), and Volume Score 10/100 (distributing, 1.61x 20D baseline).
Support & Resistance Confluence Matrix
AlgorithmicNearest support is at 83.18 [Strength: 45.0/100, Tier 3 (Intraday 1-min)] (1.16% below price with a 100.0% confirmed bounce rate across 1 tests, Reliability: Low). Nearest resistance is at 85.0 [Strength: 45.0/100, Tier 3 (Intraday 1-min)] (1.0% above price with a 100.0% confirmed rejection rate across 1 tests, Reliability: Low).
Seasonal Trend & Historical Patterns (UTOP)
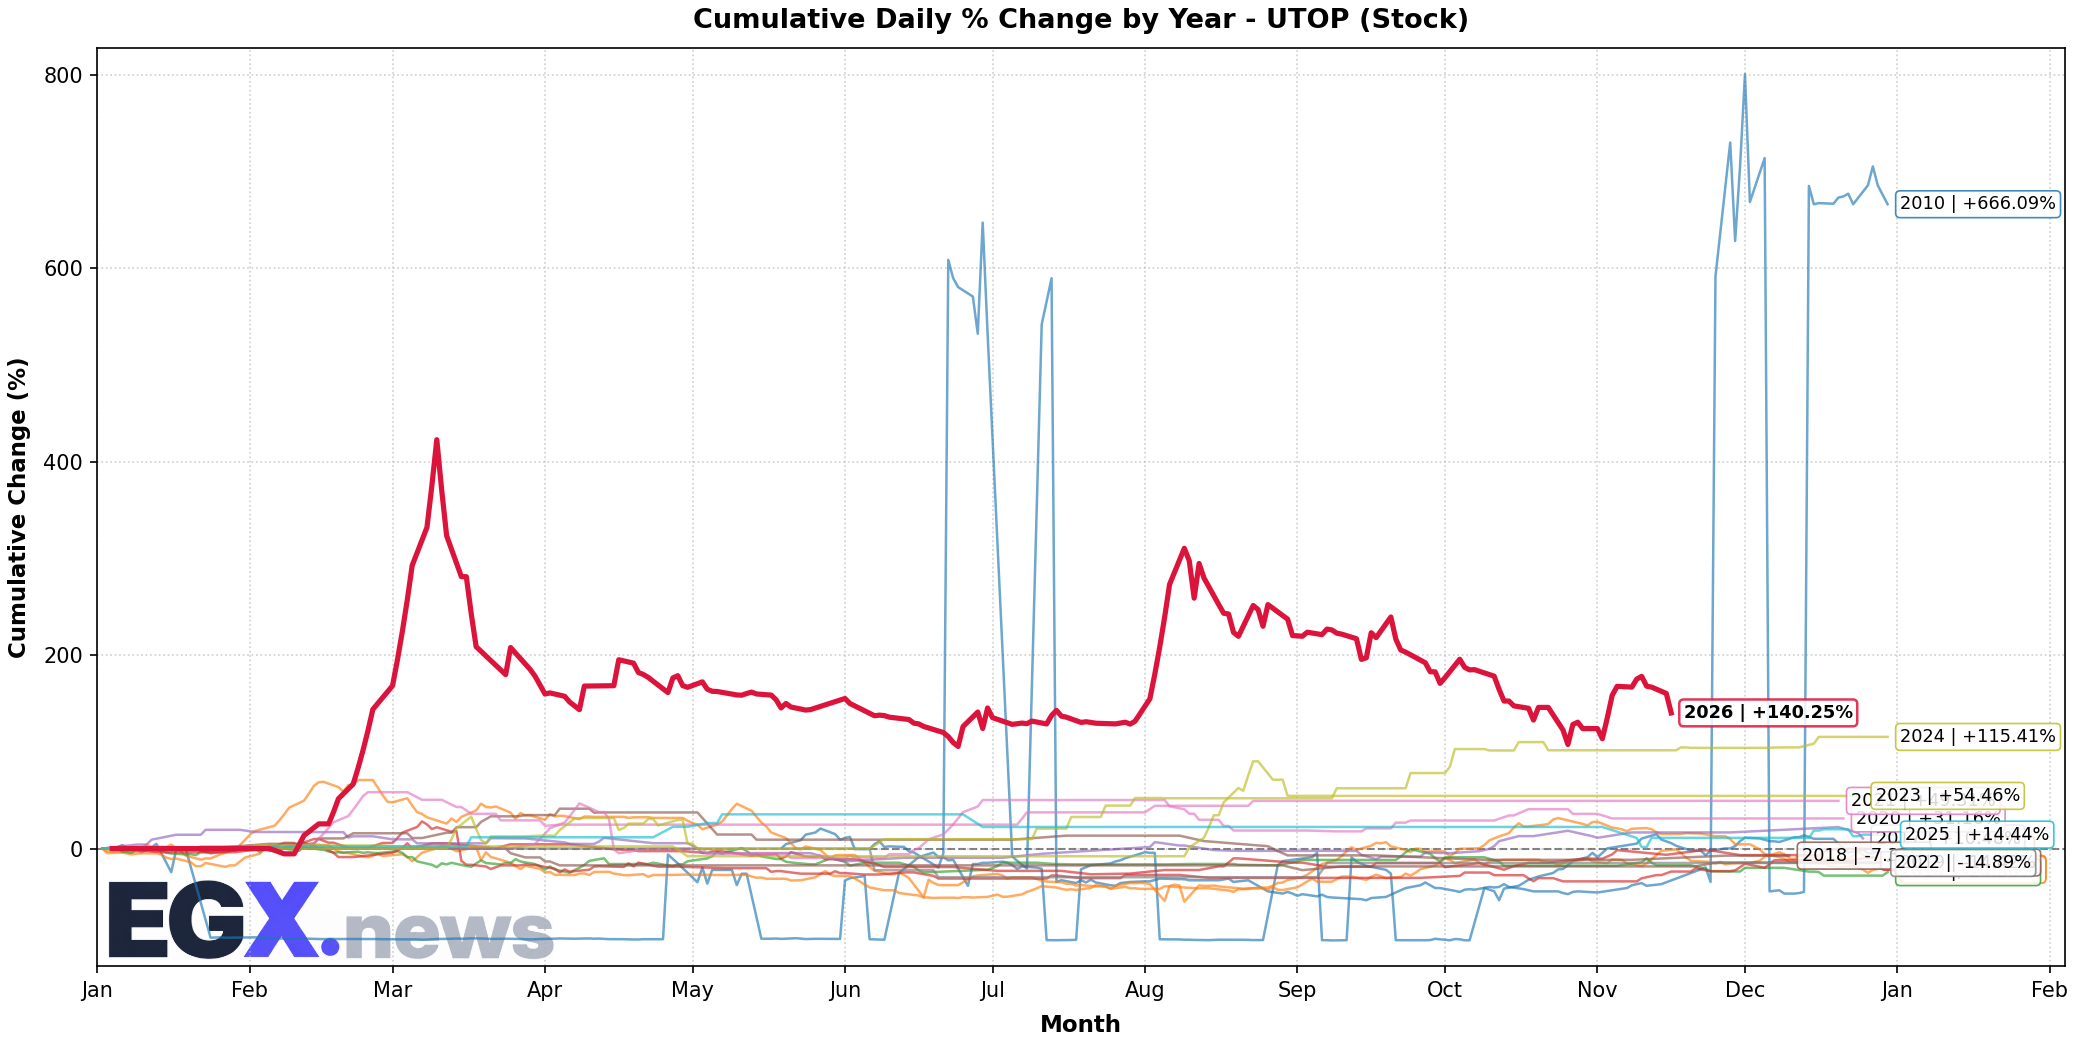
Click to EnlargeHistorical monthly seasonal return distribution and performance cycles for UTOP.
Trend Structure & Moving Averages
Golden Cross (170D)Trend Score is 25/100 with price trading 2.05% below its 20-day SMA and below the 200-day long-term benchmark (SMA50 is above SMA200 for 170 sessions).
Momentum, Volume Flow & Volatility
RSI(14) is 42.94 (Neutral), moving -14.94 over the past 5 sessions — indicating a balanced / consolidation posture. MACD line (-0.496) is above signal line (-1.673) with a histogram of +1.177 (Bullish Momentum).
20-day annualized volatility is 89.05%, ATR(14) is 7.22 (8.58% of price), and price is trading in the middle channel (%B: 0.442, Bandwidth: 35.09%).
Statistical Backtests & Historical Win Rates
BacktestedEmpirical backtesting reveals that RSI oversold dips (<30) historically yield an average 20-day return of +8.92% with a 42.86% win rate (70 observations, Reliability: Good), while volume spikes yield an average 20-day return of +36.59% (47.94% win rate).
Price sits 58.21% below All-Time High (201.41 set 158 sessions ago on 2026-03-11) and 58.21% below its 52-week high (201.41 on 2026-03-11).