


Vertika for Industry & Trade
VERTVertika for Industry & Trade
Company Overview & Activities
•اعمال التوصيف و التحليل و التصميم للمبرمجيات و قواعد البيانات و التطبيقات بمختلف أنواعها و اعمال انتاج و تطوير البرامج و التطبيقات . •انشاء قواعد البيانات و نظم المعلومات الالكترونية و تشغيلها و التدريب عليها . •انتاج المحتوى الالكترونى بصورة المختلفة من صوت و بيانات وإدخال البيانات على الحاسبات و بالوسائل الالكترونية و انشاء الأنظمة الالية و برامج الالات . •تقديم الاستشارات الإدارية و التقرير للإدارة العليا للشركات و تقديم الاستشارات الفنية في مجال تكنولوجيا المعلومات . •انشاء شبكات نقل الصوت و الصورة و المعلومات المكتوبة بعد الحصول على ترخيص من الجهات المعنية وفقا للقوانين المعمول بها و لا يشمل ذلك شبكات التليفون المحمول و صيانتها و بيع مستلزماتها . •اقامة وتشغيل مصنع لتشغيل وتشكيل المعادن •اقامة مصنع لتصنيع قطع غيار الألات و المعدات و الاسطمبات •بيع اجهزة الكمبيوتر ومستلزماتها وتوريد الاجهزة اللازمة لانشاء الأنظمة وتوريد الألات و الماكينات الصناعية . •التجارة العامة و التوزيع فيما هو مسموح به قانونا •التصدير و التوكيلات التجارية مع التزام الشركة بأحكام القانون
EGS74801C019
Listed on EGX
FRA Certified Auditor
Financial FAQ & Technical Outlook for Vertika for Industry & Trade (VERT)
Quantitative Technical Engine (VERT)
Vertika for Industry & Trade holds a Bearish technical posture (Overall Score: 39.5/100) with Trend Score 0/100, Momentum Score 70/100 (RSI 39.65 - Bearish Momentum), and Volume Score 70/100 (accumulating, 1.31x 20D baseline).
Support & Resistance Confluence Matrix
AlgorithmicNearest support is at 4.19 [Strength: 45.0/100, Tier 3 (Intraday 1-min)] (1.64% below price with a 100.0% confirmed bounce rate across 1 tests, Reliability: Low). Nearest resistance is at 4.33 [Strength: 45.0/100, Tier 3 (Intraday 1-min)] (1.64% above price with a 100.0% confirmed rejection rate across 1 tests, Reliability: Low).
Seasonal Trend & Historical Patterns (VERT)
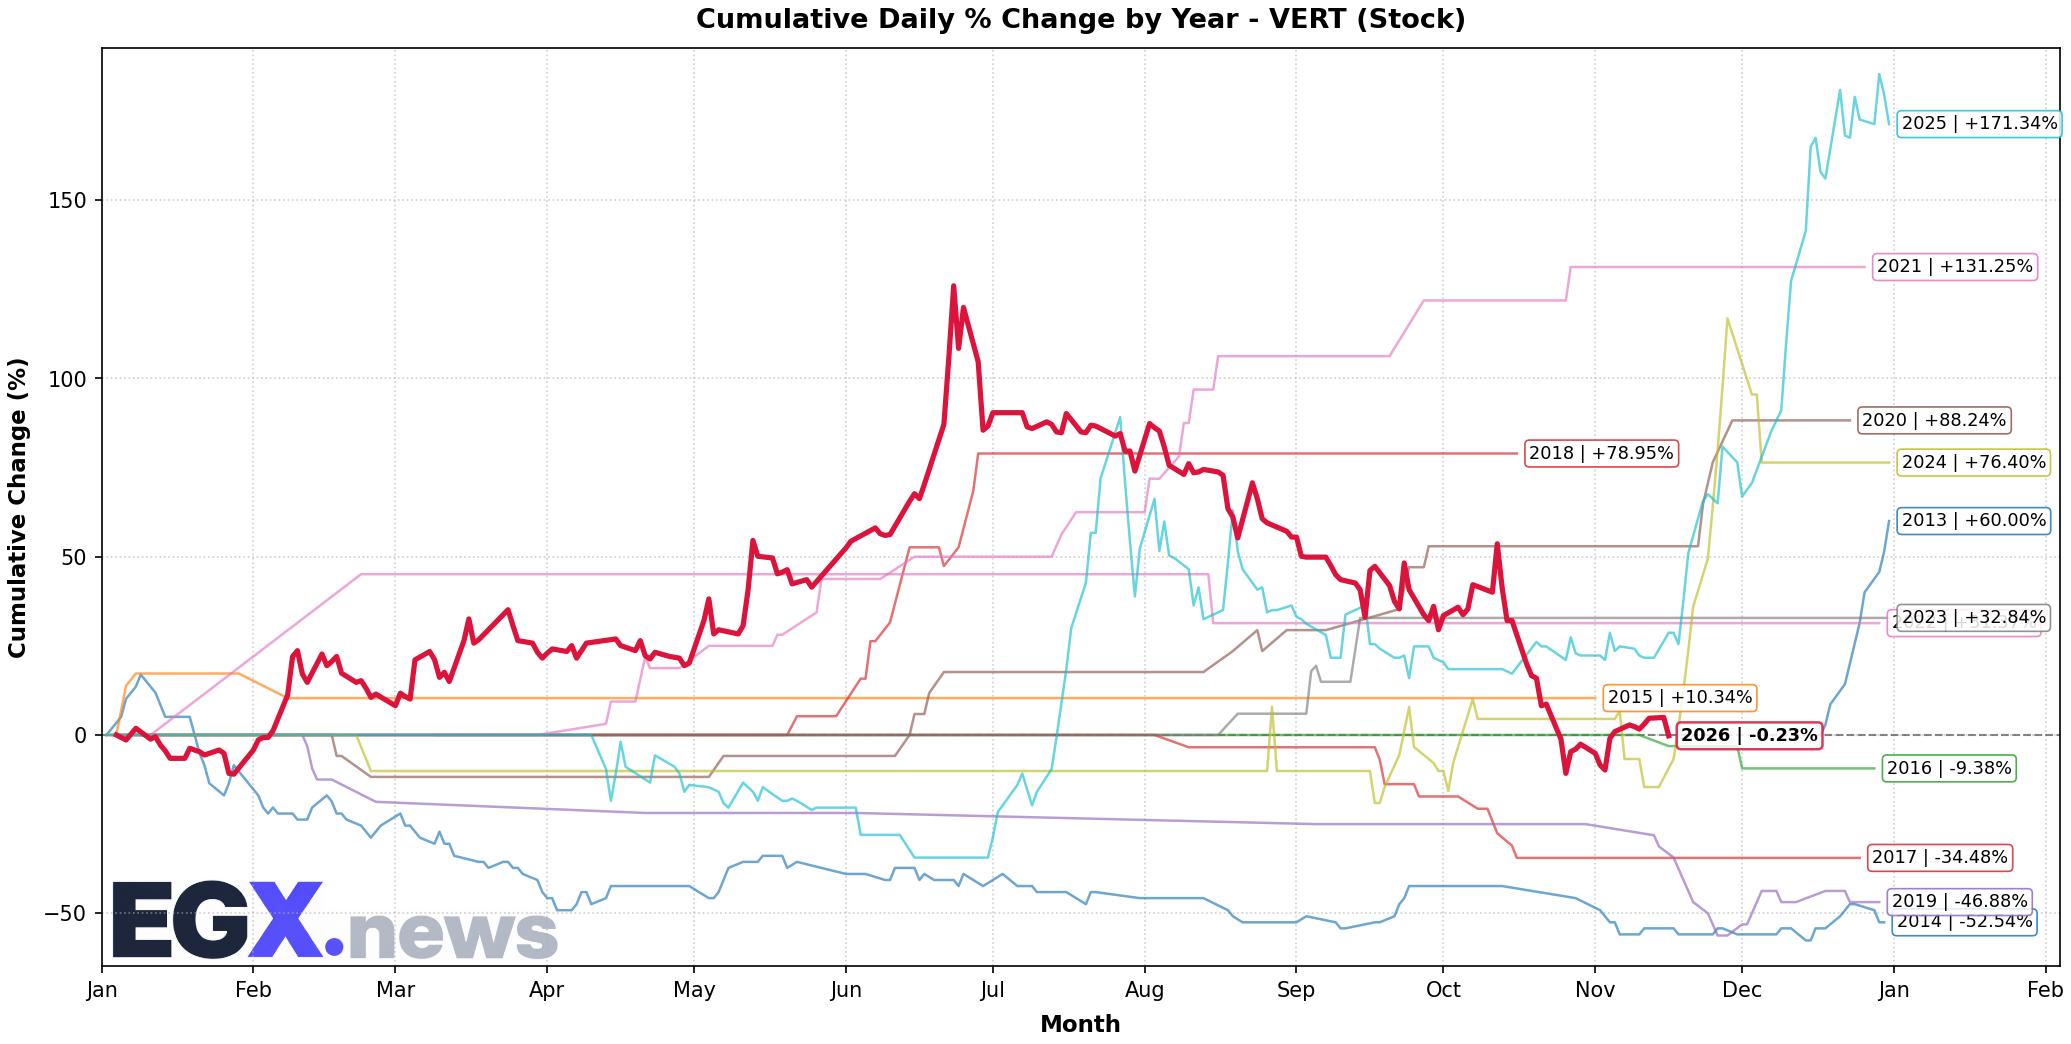
Click to EnlargeHistorical monthly seasonal return distribution and performance cycles for VERT.
Trend Structure & Moving Averages
Trend Score is 0/100 with price trading 0.47% below its 20-day SMA and below the 200-day long-term benchmark (SMA50 is below SMA200).
Momentum, Volume Flow & Volatility
RSI(14) is 39.65 (Bearish Momentum), moving -1.47 over the past 5 sessions — reflecting persistent selling pressure. MACD line (-0.27) is above signal line (-0.363) with a histogram of +0.092 (Bullish Momentum).
20-day annualized volatility is 74.33%, ATR(14) is 0.33 (7.75% of price), and price is trading in the middle channel (%B: 0.482, Bandwidth: 26.17%).
Statistical Backtests & Historical Win Rates
BacktestedEmpirical backtesting reveals that RSI oversold dips (<30) historically yield an average 20-day return of +7.90% with a 30.26% win rate (76 observations, Reliability: Good), while volume spikes yield an average 20-day return of +8.97% (41.12% win rate).
Price sits 59.7% below All-Time High (10.57 set 98 sessions ago on 2026-06-24) and 59.7% below its 52-week high (10.57 on 2026-06-24).